Estimation of the electrical conductivity of the soil from spectral information in the cultivation of rice (Oryza sativa L.) Estimación de la ...
←
→
Transcripción del contenido de la página
Si su navegador no muestra la página correctamente, lea el contenido de la página a continuación
Revista Ciencias Técnicas Agropecuarias, ISSN -1010-2760, E-ISSN: 2071-0054, Vol. 30. No.4 (October-November-December, pp. 5-11), 2021.
SUELO Y AGUA
SOIL AND WATER
https://eqrcode.co/a/k3ekmn
ORIGINAL ARTICLE | ARTÍCULO ORIGINAL
Estimation of the electrical conductivity of the soil from
spectral information in the cultivation of rice (Oryza sativa L.)
Estimación de la conductividad eléctrica del suelo a partir de
información espectral en el cultivo del arroz (Oryza sativa L.)
Ing. Roberto Alejandro García-Reyes I1, Dr.C. Mario Damian González Posada-DacostaII,
MSc. Juan Alejandro Villazón-GómezIII, Dr.C. Sergio Rodríguez-RodríguezIV
I
Universidad de Holguín, Facultad de Ciencias Naturales y Agropecuarias, Departamento de Ciencias Agropecuarias,
Holguín, Cuba.
II
Universidad de Granma, Facultad de Ciencias Técnicas, Bayamo, Granma, Cuba.
III
Universidad de Holguín, Facultad de Ciencias Naturales y Agropecuarias, Centro de Estudios para Agroecosistemas Áridos,
Holguín, Cuba.
IV
Universidad de Granma, Facultad de Ciencias Agrícolas, Centro de Estudios de Biotecnología Vegetal, Bayamo, Granma, Cuba.
ABSTRACT. The salinity of the soil constitutes today one of the main degradation processes that affects the lands under irrigation; and especially
the production of rice. The objective of the research was to estimate the electrical conductivity of the soil by means of spectral information in the
cultivation of rice in the Mayarí municipality, Holguín. The research was developed on a Chromic Vertisol, which are the most prone in the ter-
ritory to trigger degradation processes such as salinity, given by management practices in rice cultivation. Two semi-empirical models proposed
from different spectral indices were used, the NDSI and the IS, which were calculated in the QGis 3.10 software with multispectral images from
the Landsat 8 OLI / TIRS sensor. The NDSI and the SI-ASTER showed the lowest determination and negative correlation in both models. The SI
and the SI-ASTER produce an overestimation of the electrical conductivity values of the soil (EC ≥ 100%), the NDSI, SSSI.1 and SSSI.2 indicate
a moderate content of salts in the soil (EC 20% ˂ EC ≤ 40%). Although the use of spectral salinity indices yielded a high determination, the SI and
the SI-ASTER indicated an overestimation of the electrical conductivity existing in the soil, which could be due to the presence of a saturation of
the signal captured by the sensor and reflected in the indices obtained, which exceeded the values in which the saline index oscillates.
Keywords: Saline Index, Salinity, Remote Sensing.
RESUMEN. La salinidad del suelo constituye hoy en día uno de los principales procesos de degradación que afecta las tierras bajo riego; y en especial
la producción de arroz. La investigación tuvo como objetivo estimar la conductividad eléctrica del suelo mediante información espectral en el cultivo del
arroz en el municipio Mayarí, Holguín. La investigación se desarrolló sobre un Vertisol Crómico, los cuales son los más proclives en el territorio a des-
encadenar procesos de degradación como la salinidad, dado por las prácticas de manejo en el cultivo del arroz. Se utilizaron dos modelos semiempíricos
propuestos a partir de índices espectrales diferentes, el NDSI y el IS los cuales se calcularon en el software QGis 3.10 con imágenes multiespectrales del
sensor Landsat 8 OLI/TIRS. El NDSI y el SI-ASTER arrojaron la menor determinación y correlación negativa en ambos modelos. El SI y el SI-ASTER
producen una sobreestimación de los valores de conductividad eléctrica del suelo (EC ≥ 100%), el NDSI, SSSI.1 y el SSSI.2 indican un contenido mo-
derado de sales en el suelo (EC 20% ˂ EC ≤ 40%). Aunque la utilización de los índices espectrales de salinidad arrojó una alta determinación, el SI y el
SI-ASTER indicaron una sobreestimación de la conductividad eléctrica existente en el suelo lo cual podría deberse a la presencia de una saturación de la
señal captada por el sensor y reflejada en los índices obtenidos, la cual sobrepasó los valores en los cuales oscila el índice salino.
Palabras clave: índice salino, salinidad, teledetección.
Author for correspondence: Roberto Alejandro García-Reyes, e-mail: ralejandro9409@gmail.com ORCID ID: https://orcid.org/0000-0002-8950-0268
Received: 01/02/2021.
Approved: 20/09/2021.
5
Garcia-Reyes et al.: Estimation of the electrical conductivity of the soil from spectral information in the cultivation of rice (Oryza sativa L.)

    INTRODUCTION                                                                   INTRODUCCIÓN
         Soil salinity is considered an environmental problem                           La salinidad del suelo es considerado un problema a nivel
    in the world, especially in arid and semi-arid areas (Kumar                    medioambiental en el mundo, en especial en áreas de zonas
    et al., 2018). Has been reported in irrigated agricultural                     áridas y semiáridas (Kumar et al., 2018). Ha sido reportado
    lands in China, India, the United States and America                           en tierras agrícolas irrigadas de China, India, Estados Unidos
    Zaman et al. (2018), and around 20% of the lands under                         y América Zaman et al. (2018), y alrededor de un 20 % de las
    irrigation in the world express severe damage by salinity,                     tierras bajo riego en el mundo expresan severos daños por la
    low yields, causing soil degradation and also loss of fertility                salinidad, bajos rendimientos, causando la degradación del
    (Ali et al., 2019).                                                            suelo y también la pérdida de la fertilidad (Ali et al., 2019).
         Rice is considered one of the crops sensitive to salinity,                     El arroz está considerado entre los cultivos sensibles a la
    and it has been pointed out that from an electrical conduc-                    salinidad, y se ha señalado que a partir de una conductividad
    tivity of the saturated soil paste extract (Cep) of 3 dS.m -1,                 eléctrica del extracto de pasta saturada del suelo (Cep) de
    the potential yield declines rapidly in an environment of                      3 dS.m-1 el rendimiento potencial declina rápidamente en un
    a 12% for each unit increase in soil Cep Ayers & West-                         entorno de un 12% por cada incremento de unidad de la Cep
    cot, (1985) cited by Pujol et al. (2009). In a traditional                     del suelo Ayers & Westcot, (1985) citado por Pujol et al. (2009).
    way, laboratory analysis is the analysis technique used to                          De manera tradicional el análisis de laboratorio es la técnica
    characterize soil salinity, which consumes a large amount                      de análisis utilizada para la caracterización de la salinidad del
    of time and resources (Harti et al., 2016). Geostatistical                     suelo, lo cual consume una gran cantidad de tiempo y recursos
    interpolation tools are also used Balakrishnan et al. (2011)                   (Harti et al., 2016). También se utilizan herramientas geoestadís-
    for the analysis of the spatial and temporal variability of                    ticas de interpolación Balakrishnan et al. (2011), para el análisis
    the information obtained.                                                      de la variabilidad espacial y temporal de la información obtenida.
         Given this situation, the use of remote sensing or remote                      Ante esta situación se hace más factible la utilización del
                                                                                   sensoramiento remoto o teledetección. Esta novedosa técnica
    sensing becomes more feasible. This novel technique with
                                                                                   de gran potencial para la toma de datos del suelo, y ha sido uti-
    great potential for collecting soil data, and has been used for
                                                                                   lizada para la detección de la salinidad tanto en forma espacial
    the detection of salinity both spatially and temporally (Allbed
                                                                                   como temporal (Allbed et al., 2014). Su estudio se basa en las
    et al., 2014). Their study is based on the spectral characteris-
                                                                                   características espectrales del suelo.
    tics of the soil. Sidike et al. (2014), refer that soil reflectance
                                                                                        Sidike et al. (2014), refiere que la reflectancia del suelo in-
    increases when salinity increases in the visible spectrum of the
                                                                                   crementa cuando incrementa la salinidad en el espectro visible
    red and infrared bands.
                                                                                   de las bandas roja e infrarrojas. Dentro de las principales dificul-
         Among the main difficulties in obtaining spectral infor-
                                                                                   tades en la obtención de la información espectral de la salinidad
    mation on salinity is due to the presence of factors such as soil
                                                                                   es por la presencia de factores como la cobertura del suelo, el
    cover, organic matter content, and texture affect the acquisition              contenido de materia orgánica, la textura afecta la adquisición
    of information in time and space (Ding y Yu, 2014). Due to the                 de la información en el tiempo y el espacio (Ding y Yu, 2014).
    aforementioned, the objective of the research was based on                          Por lo antes expuesto el objetivo de la investigación se
    the estimation of the electrical conductivity of the soil from                 basó en la estimación de la conductividad eléctrica del suelo a
    semiempirical models of spectral information in rice cultivation               partir de modelos semiempíricos de información espectral en
    in the Mayarí municipality of, Holguín.                                        el cultivo del arroz en el municipio de Mayarí, Holguín.

    MATERIALS AND METHODS                                                          MATERIALES Y MÉTODOS
        The research was carried out in the rice production area                        La investigación se realizó en el área de producción arrocera
    known as Guaro, located in the Mayarí agroecosystem in the                     conocida como Guaro, ubicado en el agroecosistema Mayarí
    province of Holguín. A completely randomized sampling design                   en la provincia de Holguín. Se utilizó un diseño de muestreo
    was used with the elaboration of a grid of 50 meters spacing                   completamente aleatorizado con la elaboración de una grilla de
    between projected points in the WGS84 / UTM zone 18 N                          50 metros de espaciado entre puntos proyectados en el sistema
    system (Figure 1).                                                             WGS84 /UTM zona 18 N (Figura 1).
        The image used (LC08_L1TP_011046_20181219_20                                    La imagen utilizada (LC08_L1TP_011046_20181219_201812
    181227_01_T1) for the extraction of spectral information                       27_01_T1) para la extracción de la información espectral proviene
    comes from the commercial Landsat 8 OLI / TIRS satellite,                      del satélite comercial Landsat 8 OLI/TIRS, descargada del sitio
    downloaded from the site www.usgs.com of the United Sta-                       www.usgs.com del Servicio Geológico de los Estados Unidos.
    tes Geological Survey. The satellite used has the following                         El satélite utilizado tiene las siguientes características
    characteristics (Table 1). For the acquisition date of the                     (Tabla 1). Para la fecha de adquisición de las imágenes multies-
    multispectral images, the study area was planted with rice                     pectral se encontraba sembrada de arroz el área de estudio y el
    and the average rainfall up to that month was 79.0 mm and                      promedio de lluvias precipitadas hasta ese mes fue 79.0 mm y
    26.6 ° C in temperature.                                                       26.6 °C de temperatura.
6
Revista Ciencias Técnicas Agropecuarias, ISSN -1010-2760, E-ISSN: 2071-0054, Vol. 30. No.4 (October-November-December, pp. 5-11), 2021.

               FIGURE 1. Agroecosystem Mayarí (a), image of the SAS Planet of the Guaro rice production area (b) and Grid of points (c).
             FIGURA 1. Agroecosistema Mayarí (a), imagen del SAS Planet del área de producción arrocera Guaro (b) y Grilla de puntos (c).

            TABLE 1. Landsat 8 sensor characteristics OLI / TIRS according to (United State of Geological Survey, 2016)
             TABLA 1. Características del sensor Landsat 8 OLI/TIRS según (United State of Geological Survey, 2016)
                           Bands                  Band Color                   Wavelength (µm)          Resolution (m)
                             1                  Coastal Aerosol                 0.433 - 0.453                 30
                             2                       Blue                       0.450 – 0.515                 30
                             3                      Green                       0.525 – 0.600                 30
                             4                       Red                        0.630 – 0.680                 30
                             5          Near Infrared Shortwave (NIR)           0.845 – 0.885                 30
                             6           Infrared Shortwave (SWIR1)             1.560 – 1.660                 30

                              7          Infrared Shortwave (SWIR2)               2.100 – 2.300                30
                              8                  Panchromatic                     0.500 – 0.680                15
                              9                     Cirrus                        1.360 – 1.390                30

                              10           Thermal Infrared (TIRS1)               10.30 – 11.30                100
                              11           Thermal Infrared (TIRS2)               11.50 – 12.50                100

    Radiometric correction was performed on the image                             A la imagen se le realizó la corrección radiométrica para la
to eliminate the effects caused by atmospheric factors in                    eliminación de los efectos causados por factores atmosféricos en
the QGis software version 3.10 A Coruña. The spectral                        el software QGis versión 3.10 A Coruña. Los índices espectrales
index used for the estimation of electrical conductivity are                 utilizados para la estimación de la conductividad eléctrica se
shown in Table 2.                                                            muestran en la Tabla 2.
                  TABLE 2. Spectral index determined for the estimation of the electrical conductivity of the soil
                TABLA 2. Índices espectrales determinados para la estimación de la conductividad eléctrica del suelo
                                              Spectral salinity index                      References
                                            NSDI=(B4-B5) / (B4+B5)                     Khan et al. (2001)
                                               SI=SWIR1 / SWIR2                        Khan et al. (2001)
                                         SI.ASTER=(B4-B3) / (B4+B5)                     Al-Khaier (2003)
                                                  SSSI1=B9-B10                        Bannari et al. (2009)
                                        SSSI.2=(B9*B10-B10*B10) / B9                  Bannari et al. (2009)

    After the digital processing of the image resulting from                     Luego del procesamiento digital de la imagen resultante
the
.   determination  of the spectral index of salinity, the semi-              de la determinación de los índices espectrales de salinidad
                                                                                                                                                 7
Garcia-Reyes et al.: Estimation of the electrical conductivity of the soil from spectral information in the cultivation of rice (Oryza sativa L.)
empirical saline index of the electrical conductivity of the se predijo el índice salino semiempírico de la conductividad
soil was predicted through mathematical models proposed by eléctrica del suelo a través de modelos matemáticos planteados
Bannari et al. (2009) which are indicated in the Table 3. por Bannari et al. (2009) los cuales se indican en la Tabla 3.
TABLE 3. Mathematical models for the calculation of the semiempirical index of electrical conductivity and spectral index for the
determination of electrical conductivity from spectral information
TABLA 3. Modelos matemáticos para el cálculo del índice semiempírico de la conductividad eléctrica e índices espectrales para la
determinación de la conductividad eléctrica a partir de información espectral
Spectral salinity index Mathematical models to estimate the EC
NDSI CE = 627.45x2 + 147.16x + 9.71
SI CE = 1082.80x2–2202x + 1121
SI.ASTER CE = 5643x2–117.91 x + 2.18
SSSI.1 CE = 3212x2 + 132.20x + 0.397
SSSI.2 CE = 4521 x2 + 124.5x + 0.407
For the classification of soil salinity, the one proposed by Para la clasificación de la salinidad del suelo se usó la pro-
Taylor (1993) was used, it presents a scale that adopts salinity puesta por Taylor (1993), la misma presenta una escala que adop-
classes adapted for predictive models of electrical conductivity ta clases de salinidad adaptadas para modelos predictivos de la
with values between 0 % and 100% dS. m-1 respectively. The conductividad eléctrica con valores entre 0 % y 100 % dS. m-1
statistical analysis was carried out in the Statgraphics Plus respectivamente. El análisis estadístico se realizó en el software
version 5.1 software in which the linear regression analysis of Statgraphics Plus versión 5.1 en el cual se efectuó el análisis
the spectral information and the estimated values of electrical de regresión lineal de la información espectral y los valores
conductivity was carried out. estimados de conductividad eléctrica.
RESULTS AND DISCUSSION RESULTADOS Y DISCUSIÓN
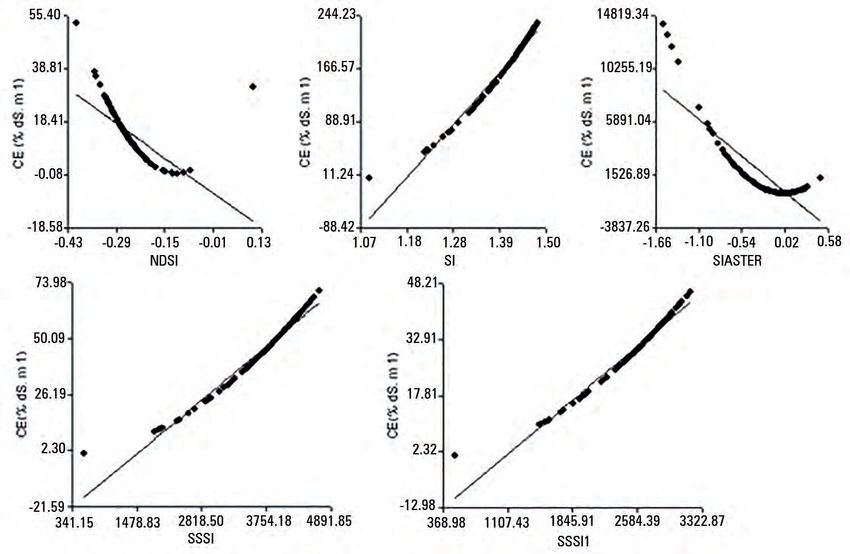
In Figure 2 the linear regression analysis of the spectral En la Figura 2 se presenta el análisis de regresión lineal de los
index vs. electrical conductivity estimated by means of the índices espectrales vs conductividad eléctrica estimada mediante
semi-empirical mathematical models is presented. It can be seen los modelos matemáticos semiempíricos. En la misma se puede
that both the spectral index used and the mathematical models, apreciar que tanto los índices espectrales utilizados como los
SI vs CE and SI.ASTER vs CE overestimate the content of salts modelos matemáticos, SI vs CE y SI.ASTER vs CE sobreestiman
in the soil and heterogeneity in the estimated values given by el contenido de sales en el suelo y heterogeneidad en los valores
the use of different spectral bands for their determination. Elhag estimados dado por el uso de diferentes bandas espectrales para
(2016) refers that the values of
the spectral index that indicate su determinación. Elhag (2016) refiere que los valores del índice
the state of soil salinity ranges from -1 (high presence of salts) espectral que indica el estado de la salinidad del suelo oscila desde
to 1 (low presence of salts in the soil). -1 (presencia alta de sales) a 1 (baja presencia de sales en el suelo).
The use of linear models to determine the error in the La utilización de modelos lineales para determinar el error en
determination of salinity by remote sensing is widely used to la determinación de la salinidad por teledetección es muy utilizado
reduce the interferences caused by the spatial and temporal al reducir las interferencias provocada por la variación espacial y
variation of salts in the soil (Scudiero et al., 2015). Studies by temporal de las sales en el suelo (Scudiero et al., 2015). Estudios rea-
Ma et al. (2017) and Bannari et al. (2009; 2016), validated the lizados por Ma et al. (2017) y Bannari et al. (2009; 2016), validaron
use of linear models for the estimation of electrical conductivity la utilización de modelos lineales para la estimación de la conduc-
from spectral information of saline index calculated from imag- tividad eléctrica a partir de información espectral de índices salinos
es from the Landsat 8 OLI / TIRS satellite. In the literature on calculados a partir de imágenes del satélite Landsat 8 OLI/TIRS.
the use of remote sensors for the determination of saline index, En la literatura referente al uso de sensores remotos para
various methods are proposed for their calculation. la determinación de índices salinos proponen diversos métodos
Khan et al. (2001) in their research propose the use of para su cálculo. Khan et al. (2001) en su investigación propone
bands 3 and 4 of the LISS-II and IRS-1B sensor by means of the el uso de las bandas 3 y 4 del sensor LISS-II y IRS-1B mediante
ground brightness adjustment index (BI), the NDSI and the IS. los índices de ajuste del brillo del suelo (BI), el NDSI y el IS.
On the other hand, Al-Khaier (2003) determined by means of Por otra parte Al-Khaier (2003) determinó mediante el
the NDSI different saline classes in the soil in a semi-arid zone NDSI diferentes clases salinas en el suelo en una zona semiárida
with bands 4 and 5 of the ASTER sensor. In the study carried con las bandas 4 y 5 del sensor ASTER.
out by Mashimbye (2013) for the determination of electrical En el estudio realizado por Mashimbye (2013) para la deter-
conductivity in the laboratory, he stated that the best way to minación de la conductividad eléctrica en laboratorio refirió que la
detect soil salinity and sodicity through remote sensors is with mejor forma de detectar la salinidad y la sodicidad del suelo mediante
the use of short-wave infrared-related bands (SWIR1). sensores remotos es con el uso de las bandas relacionadas con el
8Revista Ciencias Técnicas Agropecuarias, ISSN -1010-2760, E-ISSN: 2071-0054, Vol. 30. No.4 (October-November-December, pp. 5-11), 2021.
Other scientists have directed their study on different types infrarrojo de onda corta (SWIR1). Otros científicos han dirigido su
of soils and with salinity levels in which they use the red and estudio en diferentes tipos de suelos y con niveles de salinidad en el
near infrared bands for the analysis of vegetation and the types cual utilizan las bandas roja e infrarroja cercana para el análisis de
of salts in the soil (Howari et al., 2002). la vegetación y los tipos de sales en el suelo (Howari et al., 2002).
FIGURE 2. Linear regression analysis of spectral index vs electrical conductivity estimated by semi-empirical mathematical models.
FIGURA 2. Análisis de regresión lineal de los índices espectrales vs conductividad eléctrica estimada mediante modelos matemáticos semiempíricos.
TABLE 4. Statistical information from the linear regression analysis between the spectral index and the electrical conductivity
estimated from semi-empirical mathematical models
TABLA 4. Información estadística del análisis de regresión lineal entre los índices espectrales y la conductividad eléctrica estimada
a partir de modelos matemáticos semiempíricos
Absolute
Spectral index Coefficient of Correlation Standar Durbin
mean Model equation
vs EC determination coefficient error Watson
error
NDSI vs EC 73,5168 -0,6596 6,5097 3,8087 0,0675 EC = -7,5038 - 86,8489*NDSI
SI vs EC 97,3034 0,9864 8,5195 5,8261 0,0518 EC = -820,9512 + 705,5234*SI
SI.ASTER vs EC 73,6875 -0,8584 1351,7802 981,0384 0,0242 EC = 210,0047 - 5286,91*SI.ASTER
SSSI.1 vs EC 96,9478 0,9846 2,7584 1,9690 0,0206 EC = -28,4225 + 0,0201*SSSI.1
SSSI.2 vs EC 97,2118 0,98596 1,5671 1,0441 0,0418 EC = -20,3179 + 0,0199*SSSI.2
Table 4 presents the statistical information of the linear La Tabla 4 presenta la información estadística del análi-
regression analysis between the spectral index and estimated sis de regresión lineal entre los índices espectrales y conduc-
electrical conductivity. The NDSI vs EC model presented tividad eléctrica estimada. El modelo NDSI vs Ce presentó
the lowest coefficient of determination with 73.5168% and el menor coeficiente de determinación con un 73,5168 %
a negative correlation of -0.6596, as did the SI model. AS- y correlación negativa de -0,6596 al igual que el modelo
TER vs EC with -0.8584 which deduces that as this index SI.ASTER vs CE con -0,8584 lo cual deduce que a medida
reaches Positive values decrease the estimated electrical que este índice alcanza valores positivos disminuyen los
conductivity values. The remaining models presented a high valores estimados de conductividad eléctrica. Los modelos
9Garcia-Reyes et al.: Estimation of the electrical conductivity of the soil from spectral information in the cultivation of rice (Oryza sativa L.)
determination and correlation coefficient close to 100%. In restantes presentaron una alta determinación y coeficiente
an investigation ion made by Bannari et al. (2016) obtained de correlación cercanos al 100 %.
with the use of semi-empirical models and the NDSI and En una investigación realizada por Bannari et al. (2016) obtuvo
IS index, coefficients of determination of 70.0% and 67.0% con el uso de los modelos semiempíricos y los índices NDSI e IS coe-
respectively. ficientes de determinación de un 70,0 % y un 67,0 % respectivamente.
Based on the classification proposed by Taylor (1993), Basado en la clasificación planteada por Taylor (1993), la misma
there are differences between the estimated mean values of presenta una escala que adopta clases de salinidad adaptadas para
electrical conductivity (Figure 3). According to this author, modelos predictivos de la se aprecia diferencias entre los valores
the NDSI and SSSI.2 index show moderate salinity (20% ˂ medios estimados de conductividad eléctrica (Figura 3). De acuerdo
EC ≤ 40%) while the use of the SI-ASTER and SSSI.1 pro- a este autor los índices NDSI y SSSI.2 muestran una salinidad mode-
duce an overestimation with values greater than 100% and rada (20% ˂ EC ≤ 40%) mientras que el uso del SI-ASTER y SSSI.1
evidence of an area with extreme salinity conditions (EC ≥ producen una sobreestimación con valores superiores al 100 % y
100%). According to El-Battay et al. (2017) indicates the po- evidencia un área con condiciones extremas de salinidad (EC ≥ 100%).
tentiality of the NDSI, SI and SI-ASTER index for estimating Según El-Battay et al. (2017) indica la potencialidad de los ín-
the electrical conductivity of the soil in arid agroecosystems, dices NDSI, SI E SI-ASTER para la estimación de la conductividad
and refers that the SSSI.1 performed an overestimation with eléctrica del suelo en agroecosistemas áridos, y refiere que el SSSI.1
average values of 145.24%; which causes confusion when it realizó una sobreestimación con valores promedios de 145,24 %; el
comes to an investigation of this type. cual causa confusión cuando se trata de una investigación de este tipo.
FIGURE 3. Graphic representation of the estimated mean values of electrical conductivity through the calculated spectral index.
FIGURA 3. Representación gráfica de los valores medio estimados de conductividad eléctrica mediante los índices espectrales calculados.
CONCLUSIONS CONCLUSIONES
The determination of electrical conductivity through the La determinación de la conductividad eléctrica mediante la
use of spectral information is an indicator of this property in utilización de la información espectral es un indicador de esta
the soil and rice crop conditions studied. Although the use of propiedad en las condiciones de suelo y cultivo del arroz estudia-
spectral salinity index yielded a high determination, the SI and da. Aunque la utilización de los índices espectrales de salinidad
the SI-ASTER indicated an overestimation of the electrical arrojó una alta determinación, el SI y el SI-ASTER indicaron
conductivity existing in the soil, which could be due to the una sobreestimación de la conductividad eléctrica existente en el
presence of a saturation of the signal captured by the sensor suelo lo cual podría deberse a la presencia de una saturación de
and reflected in the index obtained, which exceeded the values la señal captada por el sensor y reflejada en los índices obtenidos,
in which the saline index oscillates. la cual sobrepasó los valores en los cuales oscila el índice salino.
REFERENCES
ALI, S.K.; ALI, S.A.; WU, Y.; ABBASI, B.; ALPI, F.G.; ALI, L.I.; ZHOU, G.: ¨An assessment of the spatial and temporal distribution of soil
salinity in combination with field and satellite data: a case study in Sujawal District¨, [en línea] Agronomy, DOI-https://doi.org/10.3390/
agronomy9120869, 9(12): 869, 2019.
AL-KHAIER, F.: Soil salinity detection using satellite remotes sensing, 61pp., Master’s Thesis, International institute for Geoinformation
Science and Earth Observation, Enschede, The Netherlands, 2003.
ALLBED, A.; KUMAR, L.; ALDAKHEEL, Y.Y.: ¨Assessing soil salinity using soil salinity and vegetation indices derived from IKONOS
high-spatial resolution imageries: Applications in a date palm dominated region¨, [en línea] Geoderma, ISSN-0016-7061, DOI-https://doi.
org/10.1016/j.geoderma.2014.03.025, 230: 1-8, 2014.
AYERS, R.S.; WESTCOT, D.W.: Water quality for agriculture, Ed. Food and Agriculture Organization of the United Nations Rome, vol. 29,
10Revista Ciencias Técnicas Agropecuarias, ISSN -1010-2760, E-ISSN: 2071-0054, Vol. 30. No.4 (October-November-December, pp. 5-11), 2021.
ISBN-92-5-102263-1, 1985.
BALAKRISHNAN, P.; SALEEM, A.; MALLIKARJUN, N.: ¨Groundwater quality mapping using geographic information system (GIS): A
case study of Gulbarga City, Karnataka, India¨, [en línea] African Journal of Environmental Science and Technology, ISSN-1996-0786,
DOI-https://doi.org/10.5897/AJEST11.134, 5(12): 1069-1084, 2011.
BANNARI, A.; GUÉDON, A.; EL-GHMARI, A.: ¨Mapping slight and moderate saline soils in irrigated agricultural land using advanced land
imager sensor (EO-1) data and semi-empirical models¨, [en línea] Communications in Soil Science and Plant Analysis, ISSN-0010-3624,
DOI-https://doi.org/10.1080/00103624.2016.1206919, 47(16): 1883-1906, 2016.
BANNARI, A.: GUEDON, A.; EL-HARTI, A.; CHERKAOUI, F.; EL-GHMARI, A.; SAQUAQUE, A.: ¨Slight and moderate saline and sodic
soils characterization in irrigated agricultural land using multispectral remote sensing¨, [en línea] International Archives of the Photo-
grammetry, Remote Sensing and Spatial Information Sciences, DOI-https://doi.org/10.1080/00103620802432717, 34(Part XXX), 2009.
DING, J.; YU, D.: ¨Monitoring and evaluating spatial variability of soil salinity in dry and wet seasons in the Werigan–Kuqa Oasis, China,
using remote sensing and electromagnetic induction instruments¨, [en línea] Geoderma, ISSN-0016-7061, DOI-https://doi.org/10.1016/j.
geoderma.2014.07.028, 235: 316-322, 2014.
EL-BATTAY, A.; BANNARI, A.; HAMEID, N.; ABAHUSSAIN, A.: ¨Comparative study among different semi-empirical models for soil
salinity prediction in an arid environment using OLI Landsat-8 data¨, [en línea] Advances in Remote Sensing, DOI-DOI: https://doi.
org/10.4236/ars.2017.61002, 6(01): 23, 2017.
ELHAG, M.: ¨Evaluation of different soil salinity mapping using remote sensing techniques in arid ecosystems, Saudi Arabia¨, [en línea]
Journal of Sensors, ISSN-1687-725X, DOI-https://doi.org/10.1155/2016/7596175, 2016, 2016.
HARTI, E.A.; LHISSOU, R.; CHOKMANI, K.; OUZEMOU, J.-E.; HASSOUNA, M.; BACHAOUI, E.M.; EL GHMARI, A.: ¨Spatiotemporal
monitoring of soil salinization in irrigated Tadla Plain (Morocco) using satellite spectral indices¨, [en línea] International Journal of
Applied Earth Observation and Geoinformation, ISSN-0303-2434, DOI-https://doi.org/10.1016/j.jag.2016.03.008, 50: 64-73, 2016.
HOWARI, F.; GOODELL, P.; MIYAMOTO, S.: ¨Spectral properties of salt crusts formed on saline soils¨, [en línea] Journal of Environmental
Quality, ISSN-0047-2425, DOI-https://doi.org/10.2134/jeq2002.1453, 31(5): 1453-1461, 2002.
KHAN, N.; RASTOSKUEV, V.; SHALINA, E.; SATO, Y.: ¨Mapping salt-affected soils using remote sensing indicators a simple approach with
the use of GIS IDRISI¨, En: 22nd Asian Conference on Remote Sensing, Center for Remote Imaging, sensing and Processing (CRISP),
National University of Singapore; Singapore, pp. 5, Singapore, 2001.
KUMAR, N.; SINGH, S.K.; PANDEY, H.: ¨Drainage morphometric analysis using open access earth observation datasets in a drought-affect-
ed part of Bundelkhand, India¨, [en línea] Applied Geomatics, ISSN-1866-928X, DOI-https://doi.org/10.1007/s12518-018-0218-2, 10(3):
173-189, 2018.
MA, Z.; SHI, Z.; ZHOU, Y.; XU, J.; YU, W.; YANG, Y.: ¨A spatial data mining algorithm for downscaling TMPA 3B43 V7 data over the
Qinghai–Tibet Plateau with the effects of systematic anomalies removed¨, [en línea] Remote Sensing of Environment, ISSN-0034-4257,
DOI-https://doi.org/10.1016/j.rse.2017.08.023., 200: 378-395, 2017.
MASHIMBYE, Z.E.: Remote sensing of salt-affected soil, 151pp., Ph.D. Thesis, Stellenbosch University, Faculty of AgriSciences, Stellenbosch,
South Africa, 2013.
PUJOL, O.R.; HERRERA, P.J.; CID, L.G.; ALARCÓN, L.R.; LÓPEZ, C.G.: ¨Evaluación del funcionamiento hidráulico del drenaje soterrado
en áreas arroceras de la zona norte de la provincia Granma, Cuba¨, Revista Ciencias Técnicas Agropecuarias, ISSN-1010-2760, e-ISSN:
2071-0054, 18(3): 30-34, 2009.
SCUDIERO, E.; SKAGGS, T.H.; CORWIN, D.L.: ¨Regional-scale soil salinity assessment using Landsat ETM+ canopy reflectance¨, [en línea]
Remote Sensing of Environment, ISSN-0034-4257, DOI-http://dx.doi.org/10.1016/j.rse.2015.08.0260034, 169: 335-343, 2015.
SIDIKE, A.; ZHAO, S.; WEN, Y.: ¨Estimating soil salinity in Pingluo County of China using QuickBird data and soil reflectance spectra¨,
[en línea] International Journal of Applied Earth Observation and Geoinformation, ISSN-0303-2434, DOI-https://doi.org/10.1016/j.
jag.2013.06.002, 26: 156-175, 2014.
TAYLOR, S.: Dryland salinity: introductory extension notes, Ed. Department of Land and Water Conservation, pp. 63, ISBN-978-0-7310-
1124-7, Sydney, Australia, 1993.
UNITED STATE OF GEOLOGICAL SURVEY: ¨Landsat Earth observation satellites: U.S. Geological Survey Fact Sheet 2015–3081¨, [en
línea] DOI-https://doi.org/10.3133/fs20153081, 4, 2016.
ZAMAN, M.; SHAHID, S.A.; HENG, L.: Guideline for Salinity Assessment, Mitigation and Adaptation Using Nuclear and Related Techniques,
Ed. Springer: New York, vol. 3, pp. 43-53, ISBN-978-3-319-96190-3, NY, USA, 2018.
Roberto Alejandro García-Reyes, Profesor de la Universidad de Holguín, Facultad de Ciencias Naturales y Agropecuarias, Departamento de Ciencias Agro-
pecuarias, Holguín, Cuba, e-mail: ralejandro9409@gmail.com ORCID ID: https://orcid.org/0000-0002-8950-0268
Mario Damian González Posada-Dacosta, Profesor de la Universidad de Granma, Facultad de Ciencias Técnicas, Bayamo, Cuba, e-mail: mgonzalezposada@
udg.co.cu ORCID ID: https://orcid.org/0000-0001-7410-6703
Juan Alejandro Villazón-Gómez, Profesor de la Universidad de Holguín, Facultad de Ciencias Naturales y Agropecuarias, Centro de Estudios para Agroeco-
sistemas Áridos, Holguín, Cuba, e-mail: villazon@uho.edu.cu ORCID ID: https://orcid.org/0000-0002-2436-0591
Sergio Rodríguez-Rodríguez, Profesor de la Universidad de Granma, Facultad de Ciencias Agrícolas, Centro de Estudios de Biotecnología Vegetal, Bayamo,
Cuba, e-mail: srodriguezr@udg.co.cu ORCID ID: http://orcid.org/0000-0003-2923-5092
The authors of this work declare no conflict of interests.
This item is under license Reconocimiento-NoComercial de Creative Commons 4.0 Internacional (CC BY-NC 4.0).
The mention of trademarks of specific equipment, instruments or materials is for identification purposes, there being no promotional commitment in relation
to them, neither by the authors nor by the publisher.
11También puede leer