Exploratory multigroup structural equation modeling approach to analyzing H. pylori infection, serological pepsinogen levels, and life style ...
←
→
Transcripción del contenido de la página
Si su navegador no muestra la página correctamente, lea el contenido de la página a continuación
Doi: https://doi.org/10.15517/psm.v0i19.48113
                                                    Volumen 19, número 2, Art. Cient. enero-junio 2022

Exploratory multigroup structural equation
modeling approach to analyzing H. pylori
infection, serological pepsinogen levels, and
life style factors in an elderly population in
Costa Rica.
Gabriel Molina-Castro, Stefany Matarrita-Muñoz, Silvia Elena Molina-Castro,
Ericka Méndez-Chacón, Clas Une, Vanessa Ramírez-Mayorga

 Como citar este artículo:

 Molina-Castro, G., Matarrita-Muñoz S., Molina-Castro, S., Mendez, E., Clas-Une. y Ramírez,
      V. (2022). Exploratory multigroup structural equation modeling approach to
      analyzing H. pylori infection, serological pepsinogen levels, and life style factors in
      an elderly population in Costa Rica. Población y Salud en Mesoamérica, 19(2). Doi:
      10.15517/psm.v0i19.48113

 ISSN-1659-0201 http://ccp.ucr.ac.cr/revista/

 Revista electrónica semestral
 Centro Centroamericano de Población
 Universidad de Costa Rica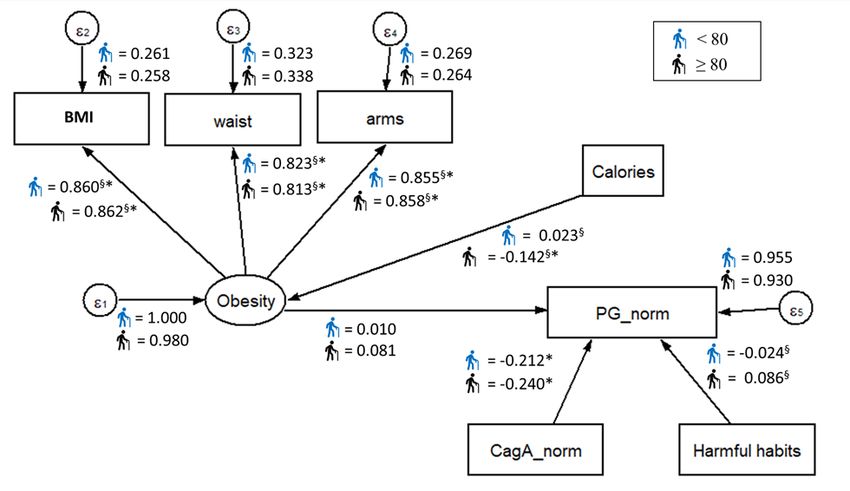
Doi: https://doi.org/10.15517/psm.v0i19.48113
                                                                       Volumen 19, número 2, Art. Cient. enero-junio 2022

            Exploratory multigroup structural equation modeling approach to analyzing
            H. pylori infection, serological pepsinogen levels, and life style factors in an
                                   elderly population in Costa Rica.

              Enfoque exploratorio del modelo de ecuaciones estructurales multigrupo para el
               análisis de la infección con H. pylori, niveles de pepsinógenos séricos y factores
               asociados a estilo de vida en una población de adultos mayores en Costa Rica.

              Gabriel Molina-Castro1, Stefany Matarrita-Muñoz2, Silvia Elena Molina-Castro3, Ericka
                           Méndez-Chacón4, Clas Une5, Vanessa Ramírez-Mayorga6

Abstract: The aim of this work is to describe and analyze the association of PGI/PGII ratio (indicator of gastric
atrophy) with H. pylori-CagA and life style factors such as caloric intake, obesity, and harmful habits amongst H.
pylori-positive elderly people infected in Costa Rica using an exploratory multigroup structural equations model
(SEM). Using a sample of 1748 H. pylori-positive elderly people from CRELES first wave study, a SEM was employed
analyze if the relationships between PGI/PGII ratio with levels of H. pylori-CagA, caloric intake, obesity, and harmful
habits, differs by sex, age and risk areas subgroups. The proposed SEMs exhibited a good fit in males (RMSEA =
0.039), females (RMSEA = 0.000), low-risk area (RMSEA = 0.038), middle-risk area (RMSEA = 0.042), individuals
under 80 years (RMSEA = 0.038) and individuals aged 80 and over (RMSEA = 0.042), while an acceptable fit was
observed for the high-risk area (RMSEA = 0.061). Fitted SEMs showed that CagA predicted PG-ratio as expected,
with effects increasing with the risk area, but similar between sex and age groups. All indicators measuring obesity
(BMI, arms, and waist) showed significant standardized coefficients, with similar effects between sex, age and risk
area groups. No other significant effects or differences between groups were identified. We propose a good-fitted
SEM model for the possible relationships between CagA and PG ratio and the geographical risk area level for
elderly people. No differences were observed on measured parameters between male and female population, or
between under 80 years and older individuals.

Key words: atrophic gastritis, CagA, serum pepsinogens, structural equations model, multigroup SEM, elderly
people, Costa Rica.

Resumen: El objetivo de este trabajo es describir y analizar la asociación entre PGI/PGII (indicador de atrofia
gástrica con H. pylori-CagA y factores asociados a estilo de vida como ingesta calórica, obesidad y hábitos nocivos
entre adultos mayores positivos por H. pylori en Costa Rica utilizando modelos de ecuaciones estructurales
multigrupo (SEM). Con una muestra de 1748 adultos mayores del estudio CRELES, se utilizó un SEM para analizar

1 Costa Rican Metrology Laboratory, San José, COSTA RICA. Correo electrónico: gmolina@lcm.go.cr ORCID: https://orcid.org/0000-
0002-4051-7229
2 Universidad de Costa Rica, San José, COSTA RICA. Correo electrónico: stefmatarrita@hotmail.com ORCID: http://orcid.org/0000-
0002-1222-1981
3 Instituto de Investigaciones en Salud, Universidad de Costa Rica, COSTA RICA. Correo electrónico: silvia.molinacastro@ucr.ac.cr
ORCID: http://orcid.org/0000-0002-7523-9919
4 Universidad de Costa Rica, San José, COSTA RICA. Correo electrónico: ericka.mendez@ucr.ac.cr ORCID: http://orcid.org/0000-0003-
3152-5179
5 Instituto de Investigaciones en Salud, Universidad de Costa Rica, COSTA RICA. Correo electrónico: allan.une@ucr.ac.cr ORCID:
http://orcid.org/0000-0003-3708-7392
6 Instituto de Investigaciones en Salud, Universidad de Costa Rica, COSTA RICA. Correo electrónico: vanessa.ramirez@ucr.ac.cr ORCID:
http://orcid.org/0000-0003-4104-3261

Gabriel Molina-Castro, Stefany Matarrita-Muñoz, Silvia Elena Molina-Castro, Ericka Méndez-
Chacón, Clas Une, Vanessa Ramírez-Mayorga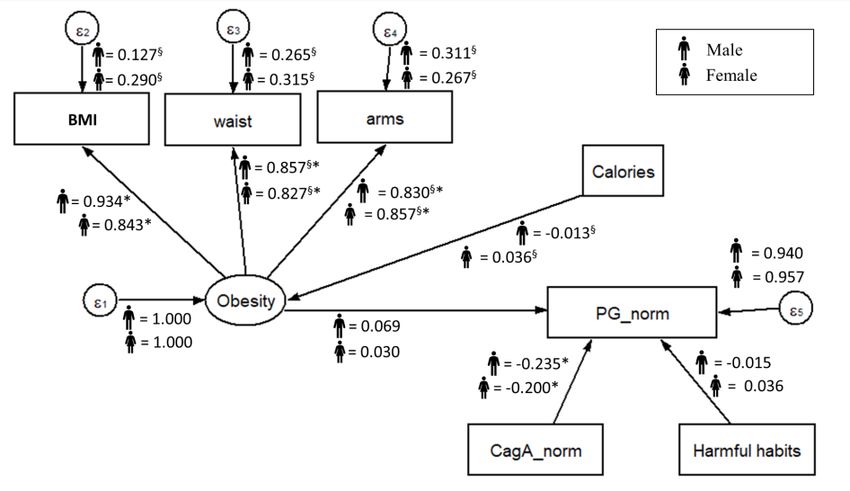
Doi: https://doi.org/10.15517/psm.v0i19.48113
                                                                      Volumen 19, número 2, Art. Cient. enero-junio 2022

las relaciones entre PGI/PGII, CagA, ingesta calórica, obesidad y hábitos nocivos difieren por sexo, edad y áreas de
riesgo. Los SEMs propuestos exhibieron un buen ajuste en hombres (RMSEA = 0.039), mujeres (RMSEA = 0.000),
área de bajo riesgo (RMSEA = 0.038), áreas de riesgo medio (RMSEA = 0.042), individuos menores de 80 años
(RMSEA = 0.038) e individuos de 80 años o más (RMSEA = 0.042), mientras que hubo un ajuste aceptable en áreas
de alto riesgo (RMSEA = 0.061). Los SEMs ajustados mostraron que CagA predice la relación PGI/II en la dirección
esperada con efectos proporcionales al área de riesgo, pero no por sexo y edad. Todos los indicadores medibles
de obesidad (IMC, brazos y cintura) mostraron coeficientes estandarizados significativos con efectos similares entre
los grupos por sexo, edad y área de riesgo. No se encontraron otros efectos o diferencias significativas.
Proponemos un modelo SEM bien ajustado para las posibles relaciones entre CagA y PGI/II y el nivel de riesgo del
área geográfica en adultos mayores. No se encontraron diferencias en las variables analizadas entre hombres y
mujeres ni entre los grupos de edad.

Palabras claves: gastritis atrófica, CagA, pepsinógenos séricos, modelos de ecuaciones estructurales, adultos
mayores, Costa Rica

                       Recibido:15ago, 2021| Corregido:26onov, 2021| Aceptado:7dic, 2021

               1. Introducción

Gastric cancer usually develops at the end of a well-established process that starts with superficial
gastritis, which evolves into atrophy, metaplasia, dysplasia, and finally, adenocarcinoma (Correa,
1992)]. The whole process takes decades and, in most cases, is initiated by infection with Helicobacter
pylori (Graham, 1997; Persson et al., 2011). H. pylori is a gram-negative, spiral, microaerophilic
bacillus that is able to colonize the gastric mucosa of humans (Marshall & Warren, 1984). Around
half the world’s population is infected with H. pylori (Azevedo, Huntington, & Goodman, 2009).
However, the prevalence of infection varies amongst high- and low-income countries, being higher
in the latter, as well as in underprivileged populations (ethnic minorities, rural areas, and migrants),
an epidemiological pattern associated directly with poverty and deficient hygienic conditions
(Burucoa & Axon, 2017; Kayali et al., 2018). Aside from gastric adenocarcinoma, which develops in
1 % to 2 % of the infected, H. pylori is associated with pathologies such as peptic ulcer and MALT
lymphoma (Malfertheiner, Chan, & McColl, 2009; Marshall, 1986; Smolka & Schubert, 2017; F. Wang,
Meng, Wang, & Qiao, 2014). Costa Rica has a high prevalence of the infection (Alpízar-Alpízar, Pérez-
Pérez, Une, Cuenca, & Sierra, 2005; Blanco-Delgado et al., 2001; Miranda et al., 1998; R. Sierra et al.,
1992; R. Sierra et al., 2008; R. Sierra et al., 2006; Sigarán et al., 1992) and an elevated incidence of
gastric cancer and its associated mortality (Bray et al., 2018; Ferlay et al., 2018).

The presence of different virulence factors has been widely described in H. pylori, some of which are
related to the pathologies that occur during infection (Lu, Yamaoka, & Graham, 2005; Polk & Peek,
2010; Wen & Moss, 2009; Wroblewski, Peek, & Wilson, 2010). The presence of the cytotoxin-

Gabriel Molina-Castro, Stefany Matarrita-Muñoz, Silvia Elena Molina-Castro, Ericka Méndez-
Chacón, Clas Une, Vanessa Ramírez-Mayorga
Doi: https://doi.org/10.15517/psm.v0i19.48113
Volumen 19, número 2, Art. Cient. enero-junio 2022
associated gene A (CagA) is the most important feature of the bacterium in relation with higher risk
of gastric adenocarcinoma and its pre-malignant lesions (Atherton et al., 1995; Covacci et al., 1993;
Cover & Blaser, 1992; Yamaoka & Graham, 2014). In the context of the infection, these factors
contribute to a sustained inflammatory process that results in damage and atrophy of the epithelium
and favors the malignant transformation (Qadri, Rasool, Gulzar, Naqash, & Shah, 2014). The spectrum
of severity is variable, depending on an interplay between genetic factors and immune status of the
host, the environmental context, and bacterial virulence factors, (Atherton, 2006; Polk & Peek, 2010;
Yamaoka, 2010). In the host, an exacerbated inflammatory response could be associated with gene
polymorphisms that also increase the risk of gastric cancer (Alpízar-Alpízar et al., 2005; El-Omar et
al., 2000; Taguchi et al., 2005). Regarding the behavioral factors, diets with low intake of antioxidants
and high salt intake, as well as tobacco smoking, have been linked to increased risk of gastric cancer
(Crew & Neugut, 2006; Fox et al., 1999; Jayalekshmi et al., 2015; Menaker, Sharaf, & Jones, 2004).
The clinical presentation of precancerous lesions and early gastric tumors can mimic the symptoms
of common gastric disease, which results in a late diagnosis, where the treatment is likely to fail.
Therefore, current research efforts are directed to the identification of markers of initial lesions that
allow detection at early stages, where treatment could be more effective. So far, the most promising
ones are serum pepsinogens and gastrin (Cao, Ran, & Xiao, 2007; Dinis-Ribeiro et al., 2004). The
proteolytic enzyme pepsin is produced as two types of pepsinogens (PGI and PGII) in the gastric
mucosa and secreted to the gastric lumen to carry out its digestive function. However, a small
amount escapes into the bloodstream and can be quantified by serology (Brenner, Rothenbacher, &
Weck, 2007; Sipponen, Härkönen, Alanko, & Suovaniemi, 2003). The expression pattern of PG is
altered by gastric inflammation and atrophy and these changes reflect in PG blood concentrations,
with PGI and PGI/PGII ratio decreases in association with gastric atrophy, especially in the body of
the stomach. As atrophy is considered a precancerous lesion, blood PG concentrations are used to
screen the risk for gastric cancer (Sipponen, Samloff, Saukkonen, & Varis, 1985). In Costa Rica, gastric
cancer ranks third in cancer related deaths and this is mostly due to late detection (GLOBOCAN,
2012). This highlights the importance of having reliable and affordable markers for the screening of
gastric cancer risk. We have previously shown that low PG values and H. pylori-CagA+ infection are
associated with risk of gastric atrophy and cancer in Costa Rican population (Rafaela Sierra et al.,
2003; Sierra et al., 2008; Sierra et al., 2006).
In this study, we used an exploratory multigroup structural equation modeling (SEM) approach to
describe and analyze the association of PGI/PGII ratio, as an indicator of gastric atrophy, with H.
pylori-CagA and environmental factors such as caloric intake, obesity, and harmful habits amongst
H. pylori-positive elderly people infected in Costa Rica. Our general model was consistent for the
evaluation of different subgroups amongst the population, showing the pertinence of serum PG
levels as a non-invasive test to evaluate the presence of atrophy and increased gastric cancer risk.
Gabriel Molina-Castro, Stefany Matarrita-Muñoz, Silvia Elena Molina-Castro, Ericka Méndez-
Chacón, Clas Une, Vanessa Ramírez-MayorgaDoi: https://doi.org/10.15517/psm.v0i19.48113
Volumen 19, número 2, Art. Cient. enero-junio 2022
2. Theoretical reference
Structural Equation Modeling. Structural equation models (SEMs) are part of a family of multivariate
statistical models used to estimate the effect and relationships between multiple variables (Ruiz,
Pardo, & San Martín, 2010). Also known as LISREL models or covariance structure analysis, SEMs
represent an alternative to explore possible causal theoretical approaches with data obtained from
observational or correlational studies [46-48]. It is important to note that SEMs do not prove
causality, but they do account for empirical evidence in favor or not of a causal approach.
The roots of SEMs can be traced from three other older multivariate techniques: confirmatory factor
analysis that comes from psychology, path analysis that comes from biology and genetics, and
systems of simultaneous equations that were developed in economics. A complete SEM integrates
these three techniques (Kaplan, 2008; Montero, 2012). The interest in SEMs is generally on theoretical
constructs, which are represented by latent variables, characteristics that would be useful to measure
but cannot be observed. A factor model, which is often called the measurement model, specifies
how the latent factors are measured by the observed variables, as measurable characteristics in the
study subjects (Hox, Moerbeek, & van de Schoot, 2010; Ruiz et al., 2010). SEMs usually also include
error variables that represent the errors associated with the measurement of the observed variables.
SEMs are often visualized by a graphical path diagram known as structural diagram. An example of
a structural diagram is shown in figure 1.
Figure 1.
Example of a structural diagram used to visualize SEM (β, γ, and ξ correspond to regression
coefficient of the model)
Gabriel Molina-Castro, Stefany Matarrita-Muñoz, Silvia Elena Molina-Castro, Ericka Méndez-
Chacón, Clas Une, Vanessa Ramírez-MayorgaDoi: https://doi.org/10.15517/psm.v0i19.48113
Volumen 19, número 2, Art. Cient. enero-junio 2022
Structural diagrams follow particular conventions that are necessary to know in order to derive the
corresponding equations. The observable variables are represented enclosed in rectangles, the
unobservable variables (latent) and the error variables in ovals or circles, any structural effect is
represented as a straight arrow from the predictor variable to the dependent variable, and the model
parameters (coefficients) are represented on the corresponding arrow (Hox & Bechger, 1999; Ruiz et
al., 2010).
Mathematically, these models are more complex to estimate than other multivariate models such as
regression or exploratory factor analysis (Ruiz et al., 2010). Statistically, the model is evaluated by
comparing two variance/covariance matrices. A sample variance/covariance matrix is calculated from
the data. From this matrix and the model, an estimated population variance/covariance matrix is also
computed. If the estimated population variance/covariance matrix is very similar to the known
sample variance/covariance matrix, then the model is said to fit the data well (Hox et al., 2010). Once
a model has been estimated, it is necessary to evaluate its quality using goodness of fit statistics.
There are three types of goodness of fit statistics widely used: absolute fit statistics (e.g. chi-square),
relative fit statistics (e.g. comparative fit index CFI and Tucker-Lewis index TLI), and parsimonious fit
statistics (e.g. Root Mean Square Error of Approximation RMSEA). Use and interpretation of these
statistics are discussed in (Hox & Bechger, 1999; Ruiz et al., 2010).
3. Materials and methods
3.1 Scope, database, and sample design.
The dataset used in this study was gathered from two research projects: "Costa Rica: Longevity and
Healthy Aging Study” (CRELES, for its Spanish acronym), a longitudinal study based on a national
sample representing elderly people in Costa Rica, with an oversampling of people ninety years old
and over, and “Blood pepsinogen levels to identify people at high risk of gastric cancer in an adult
Costa Rican population” [52]. CRELES study included people of any nationality residing in Costa Rica
that were born before 1946, that is, 60 years old or older by the time of the first interview. They were
randomly selected from the Costa Rican 2000 Census database, for a total of 9 600 individuals aged
55 and over. Five-year age groups stratification was made afterwards. The sampling fraction in these
groups varied between 1 % for those born in 1941 to 1945 and 100 % for those born before 1905.
The sample covered 59 % of the national territory (Brenes-Camacho & Rosero-Bixby, 2008). The 2827
people who were located, interviewed, and underwent the clinical tests were included in the study.
Pepsinogen concentrations and seroprevalence for H. pylori and CagA were assessed, and the
participants were classified following the ABCD system. For the present study, CRELES first wave data
Gabriel Molina-Castro, Stefany Matarrita-Muñoz, Silvia Elena Molina-Castro, Ericka Méndez-
Chacón, Clas Une, Vanessa Ramírez-MayorgaDoi: https://doi.org/10.15517/psm.v0i19.48113
Volumen 19, número 2, Art. Cient. enero-junio 2022
was used, and the original sample was reduced to the individuals with positive results for H. pylori
infection. Subjects with missing or incomplete information, and the extreme values for all the
quantitative variables were excluded. Finally, a data sample of 1748 individuals was obtained. All
participants provided informed consent. The University of Costa Rica Ethics Committee approved the
procedure for collecting data and the informed consent form. Pepsinogen I and II levels were tested
for all the 1748 samples from the CRELES population.
3.2 Measures.
All the data was obtained from the CRELES study databases, and the coding and secondary analysis
were performed specifically for this study.
Body Mass Index (BMI). For each individual, weight and height were measured and body mass index
(BMI) was calculated as weight divided by height squared. Missing values of height and weight
imputed with a linear regression model. For height, knee height, age and sex were used as
explanatory variables. The weight model included the variables waist circumference, calf
circumference, height, age and sex.
Waist circumference (waist). For each individual, waist circumference was measured in cm, with the
participants standing, in a semi-anatomical position (with the feet separated and the palm of the
hands resting on the lateral thigh) using medical measuring tapes.
Arm circumference (arms). For each individual, arm circumference was measured in cm, with the
person seated or standing, considering the half point between the acromion (or posterior bone of
the shoulder) and the olecranon or protruding bone of the elbow, using medical measuring tapes.
Caloric intake (calories). For each individual, caloric intake was defined as the total energy per day
(kcal/d). The consumed calories quantity was estimated from the frequencies declared by the
participants in a questionnaire of food intake frequency (Kabagambe et al., 2001).
Harmful habits. The measure for harmful habits comprised two measures related with smoking and
drinking alcohol. First one includes the question “Have you smoked more than 100 cigars in your
life?” with two possible response categories: “yes” (score: 1) or “no” (score: 0). The other one includes
the question “Have you ever drunk alcoholic beverages regularly in your life?” with five possible
response categories: “occasionally”, “daily”, “just in special occasion”, “not a current drinker, but
drank” or “never drank”. These five categories were reduced to three, considering “current drinkers”
(score: 2), “not current drinkers but drank” (score: 1) and “never drank” (score: 0). Both smoking and
drinking scores were combined into one, considering that the higher the score, the worse are the
harmful habits.
Gabriel Molina-Castro, Stefany Matarrita-Muñoz, Silvia Elena Molina-Castro, Ericka Méndez-
Chacón, Clas Une, Vanessa Ramírez-MayorgaDoi: https://doi.org/10.15517/psm.v0i19.48113
Volumen 19, número 2, Art. Cient. enero-junio 2022
H. pylori serology. Serum antibodies to H. pylori were measured in a qualitative Enzyme Linked
Immunosorbent Assay (ELISA) developed in INISA and based on a modification of a previously
described ELISA (Ferrer-Ferrer et al., 2013; Perez-Perez, Dworkin, Chodos, & Blaser, 1988).
CagA serology (CagA). Serum antibodies to CagA were measured by in-house ELISA as previously
described (Blaser et al., 1995b). Both continuous and dichotomous (cutoff-value: 0.35) variables were
evaluated. Due to the observed (and expected) asymmetric distribution for the continuous variable,
the measure distribution was normalized maintaining its original mean and standard deviation.
Pepsinogen ratio (PG). Serum pepsinogens were determined by ELISA (Biohit Oyi, Finland), according
to the manufacturer’s instructions, and PG ratio (PGI/PGII) was calculated. Due to its observed (and
expected) asymmetric distribution, the measure distribution was normalized maintaining its original
mean and standard deviation.
3.3 Statistical analysis.
Differences across samples on the average of the manifest indicators were tested using a Multivariate
Analysis of Variance (MANOVA) and descriptive statistics. Multigroup structural equations modeling
(SEM) analyses were conducted using Stata 14.0 software (Stata-Corp, College Station,
USA)(StataCorp, 2015), considering sex (male and female), age groups (< 80 and ≥ 80) and risk area
(high, medium, low). A unique SEM model was examined across all groups (multigroup SEM), in
which obesity mediated the relationship between calories and PG, and direct paths between CagA
and harmful habits with PG were defined as well. In this model, obesity was measured as a latent
variable, using arms, waist and BMI as its observed indicators. All remaining variables were
considered as observed indicators. Structural diagrams are shown in the results section below.
The covariance matrix of the measures and parameter estimates were calculated using the maximum
likelihood method. Structural coefficients were considered relevant if their values were greater than
0.10, meanwhile, measurement coefficients were considered relevant if their magnitudes were
greater than 0.30(Hays, Revicki, & Coyne, 2005).
For the assessment of the goodness of fit of the multigroup structural equation models, several
indicators were examined, including chi-square test and RMSEA. Chi-square test should have a
probability value greater than 0.05 to indicate a good fit, but it is recognized that this parameter is
strongly influenced by sample size and other parameters [60]. RMSEA less than 0.05 indicates good
fit, and values between 0.05 and 0.10 are considered acceptable.
Gabriel Molina-Castro, Stefany Matarrita-Muñoz, Silvia Elena Molina-Castro, Ericka Méndez-
Chacón, Clas Une, Vanessa Ramírez-MayorgaDoi: https://doi.org/10.15517/psm.v0i19.48113
Volumen 19, número 2, Art. Cient. enero-junio 2022
4. RESULTS
4.1 Descriptive and preliminary inference analysis.
Descriptive statistics for the data are shown in Table 1. The MANOVA showed a general multivariate
effect of sex on all indicators (p < 0.05), supporting the idea of conducting the main analysis for each
sex separately. Univariate ANOVAs indicated significant difference across sex for harmful habits,
arms, and waist (p < 0.001 for all three) and calories (p < 0 .05). Moreover, the MANOVA by risk area
showed means differ between indicators among these groups (p < 0.001). Despite these results,
univariate ANOVAs only indicated significant difference across risk areas for PG (p < 0.001). In a
similar way, MANOVA showed a general multivariate effect of age group on all indicators (p < 0.001),
but univariate ANOVAs indicated significant difference across age group only for CagA, arms, BMI,
and waist (p < 0.001 for all four) and calories (p < 0.05).
Table 1.
Descriptive statistics for all indicators across samples.
Middle-
Global Male Female Low-Risk High-Risk Age < 80 Age ≥ 80
Risk
Variables (n = 1748) (n = 815) (n = 933) (n = 352) (n = 441) (n = 1170) (n = 578)
(n = 955)
Mean S.E Mean S.E Mean S.E Mean S.E Mean S.E Mean S.E Mean S.E Mean S.E
PG 8 4.6 8 4.8 7.9 4.3 9.1 5.6 7.8 4.3 7.3 4 8 4.6 7.8 4.6
CagA 0.5 0.3 0.5 0.3 0.5 0.3 0.4 0.3 0.5 0.3 0.5 0.3 0.5 0.3 0.4 0.3
Harmful
2.7 1.5 3.7 1.2 1.8 1.3 2.7 1.6 2.7 1.5 2.7 1.6 2.7 1.6 2.6 1.5
habits
Arms 29.2 4.5 28.8 3.8 29.5 5 28.9 4.5 29.3 4.5 29 4.5 30.2 4.2 27 4.3
BMI 26.2 5.3 25.3 4.2 26.9 6.1 26.1 5.5 26.1 5.4 26.4 5.1 27 5.2 24.5 5.1
Waist 92.5 12.6 92.4 10.8 92.6 14 92 13.2 92.7 12.2 92.5 13 93.8 12.5 90 12.4
Calories 2067.9 646 2192 638 1960 634 2112 664 2072 648 2024 627 2103 655 1997 623
S.E: Standard Error.
Post-hoc comparison showed that men have worse harmful habits, larger arm and waist
circumferences, and more calorie-intake than women. Also, data showed that individuals from low-
risk areas had a higher pepsinogen ratio average in comparison with those from middle- and high-
Gabriel Molina-Castro, Stefany Matarrita-Muñoz, Silvia Elena Molina-Castro, Ericka Méndez-
Chacón, Clas Une, Vanessa Ramírez-MayorgaDoi: https://doi.org/10.15517/psm.v0i19.48113
Volumen 19, número 2, Art. Cient. enero-junio 2022
risk areas. Finally, means comparison showed that people under 80 years have larger arms and waist
circumferences, and consume more calories, than older people.
Bivariate correlation matrix between all indicators is presented in Table 2. No change across samples
was observed for this correlation matrix (data no shown). A strong positive relationship between
BMI, arms and waist was observed, while a negative relationship between PG and CagA. It is
remarkable, however, that this last correlation did not show statistical significance.
Table 2.
Bivariate correlations between all indicators.
Variable 1 2 3 4 5 6 7
1 PG 1.00
2 CagA -0.23 1.00
Harmful
3 0.02 -0.02 1.00
habits
4 Arms 0.02 0.00 -0.03 1.00
5 BMI 0.05 -0.03 -0.10 0.74* 1.00
6 Waist 0.05 -0.04 0.03 0.71* 0.73* 1.00
7 Calories 0.05 -0.01 0.15 0.00 -0.02 0.00 1.00
* p < 0.05
4.2 Multigroup structural equation models (SEM).
Diagrams for the fitted SEM models with their standardized parameter estimates across samples are
shown in Figure 2, Figure 3, and Figure 4. Models were fitted considering CagA as a continuous
variable and as a dichotomous variable (positive or negative, cutoff value = 0.35), although no
statistical difference was observed between those models. Use of continuous variables was preferred
due to the adequacy of the estimation method. For all chi-square tests 27 degrees of freedom ([27])
were used.
Gabriel Molina-Castro, Stefany Matarrita-Muñoz, Silvia Elena Molina-Castro, Ericka Méndez-
Chacón, Clas Une, Vanessa Ramírez-MayorgaDoi: https://doi.org/10.15517/psm.v0i19.48113
Volumen 19, número 2, Art. Cient. enero-junio 2022
Figure 2.
Standardized parameters estimated for the proposed SEM model by sex. The values indicated
standardized regression coefficient (β, γ, and ξ). ∗Significant coefficient with p < 0.05. §Coefficient
is significantly different across samples.
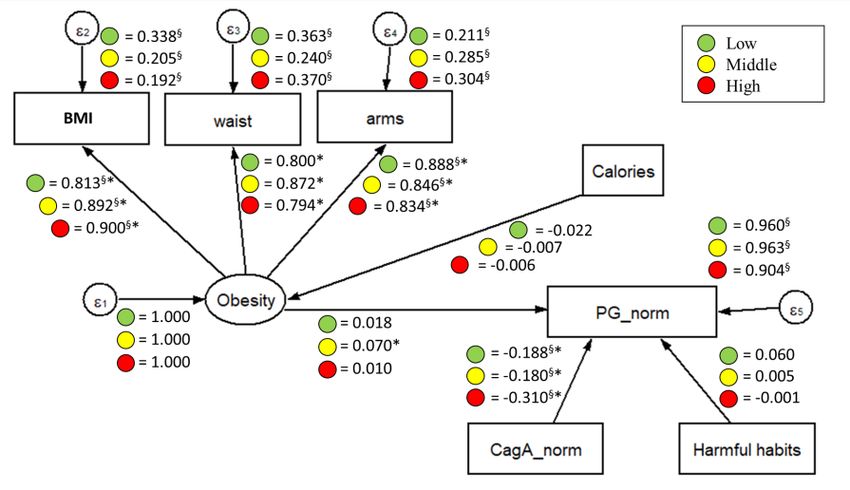
Figure 3.
Standardized parameters estimated for the proposed SEM model by risk areas. The values
indicated standardized regression coefficient (β, γ, and ξ). ∗Significant coefficient with p < 0.05.
§Coefficient is significantly different across samples.
Gabriel Molina-Castro, Stefany Matarrita-Muñoz, Silvia Elena Molina-Castro, Ericka Méndez-
Chacón, Clas Une, Vanessa Ramírez-MayorgaDoi: https://doi.org/10.15517/psm.v0i19.48113
Volumen 19, número 2, Art. Cient. enero-junio 2022
Figure 4.
Standardized parameters estimated for the proposed SEM model by age group. The values
indicated standardized regression coefficient (β, γ, and ξ). ∗Significant coefficient with p < 0.05.
§Coefficient is significantly different across samples.
The results reveal that the proposed model exhibited a good fit in both males (χ2[27] = 24.802, p <
0.05, RMSEA = 0.039) and females (χ2[27] = 5.556, p > 0.05, RMSEA = 0.000) (Figure 2). The
standardized results showed that CagA preliminary predicted PG in the expected direction (the
higher/positive CagA, the less PG), in both male (β = –0.235) and females (β = –0.200), with a similar
effect in both cases. All indicators involved in the measurement model for obesity (BMI, arms, and
waist) showed significant standardized coefficients, with similar effects in both males and females.
No other factors on the fitted model revealed statistical significance effects or differences between
sex groups.
By analyzing the fitted multigroup model across risk areas (Figure 3), good fitness was found in the
low-risk group (χ2[27] = 16.665, p > 0.05, RMSEA = 0.038), and for the middle-risk group (χ2[27] =
29.602, p < 0.05, RMSEA = 0.042), while an acceptable fit was found for the high-risk group (χ2[27]
= 28.838, p < 0.05, RMSEA = 0.061). Perhaps, the most interesting finding was that the apparent
effect of CagA on PG increased as the risk area level increased as well (χ2[27] = 6.865, p < 0.05),
having the highest apparent effect in individuals from high-risk areas (βlow = –0.188, βmid = –0.180
y βhigh = –0.310) and maintaining the same expected effect direction as in the fitted model for sex
groups. Also, the apparent effect of latent variable obesity on PG was found statistically significant
for individuals from the middle-risk areas, but the magnitude of this effect was not considered
Gabriel Molina-Castro, Stefany Matarrita-Muñoz, Silvia Elena Molina-Castro, Ericka Méndez-
Chacón, Clas Une, Vanessa Ramírez-MayorgaDoi: https://doi.org/10.15517/psm.v0i19.48113
Volumen 19, número 2, Art. Cient. enero-junio 2022
relevant. All indicators involved in the measurement model for obesity (BMI, arms, and waist) showed
significant standardized coefficients, with similar effects in all the risk areas.
Finally, the fitted multigroup model presented good fitness values for both age groups (χ2[27] =
64.271, p < 0.05, RMSEA = 0.038 for individuals under 80 years; χ2[27] = 29.602, p < 0.05, RMSEA =
0.042 for individuals aged 80 and over) (Figure 4). Similarly, CagA remained as a significant predictor
of PG for both age groups, maintaining the same expected effect direction as in the other fitted
models (β = –0.212 for individuals under 80 years, β = –0.240 for individuals aged 80 and over). It
was also noticed that the regression coefficient between calories and obesity was statistically
significant and relevant, but only for individuals aged 80 and over (β = –0.142), indicating that more
caloric intake, the less obesity. Despite this finding, the effect of obesity on PG remained non-
significant statistically neither relevant. No other factors on the fitted model revealed statistical
significance effects or differences between age groups.
5. Discussion
H. pylori infected patients develop superficial gastritis, and approximately 50 % progress to atrophy,
which is considered an independent risk factor for the development of gastric cancer (Shichijo et al.,
2017; Song, Kim, Jin, Lim, & Yang, 2017). The course of disease is partly due to environmental
conditions and genetics of the host, but also to the presence of particular virulence factors in the
infecting bacterial strain (Correa & Piazuelo, 2012). Our results showed a good fit for the structural
equations model for the considered variables. This was expected as CagA is the main oncogenic
factor of H. pylori, and atrophic gastritis is the first step in the precancerous cascade. The other
evaluated variables had some significant influence, but with a lower weight or non-significant
influence at all, probably because of the biological importance and direct oncogenic effect of CagA.
CagA binds to and deregulates intracellular signaling molecules changing the host cell signaling
pathways (Higashi, Tsutsumi, Muto, et al., 2002; Yamazaki et al., 2003), such as the oncogenic Ras-
Erk MAP kinases cascade (Higashi et al., 2004; Neel, Gu, & Pao, 2003) intercellular adherence and
communication (Murata-Kamiya, 2011; Tsutsumi, Takahashi, Azuma, Higashi, & Hatakeyama, 2006),
and cytoskeleton dynamics. Altogether, these alterations explain why the sole presence of CagA is
enough to unleash the carcinogenic process in vitro and in vivo (Hatakeyama, 2003, 2004; Ohnishi
et al., 2008), and the presence of CagA+ H. pylori strains has been associated with high risk of gastric
cancer and precancerous lesions in numerous populations, including ours (Blaser et al., 1995a; Con
et al., 2006; Kuipers, Pérez-Pérez, Meuwissen, & Blaser, 1995; Sierra et al., 2008). Another plausible
explanation for this observation is that the information about caloric intake and harmful habits, was
obtained from estimations and subjective references from the individuals, and the data collection
Gabriel Molina-Castro, Stefany Matarrita-Muñoz, Silvia Elena Molina-Castro, Ericka Méndez-
Chacón, Clas Une, Vanessa Ramírez-MayorgaDoi: https://doi.org/10.15517/psm.v0i19.48113
Volumen 19, número 2, Art. Cient. enero-junio 2022
instrument used was not made specifically for this study, introducing a certain degree of incertitude
and bias.
Regarding the results related with sex groups, it is important to consider that a higher risk for
developing gastric cancer has been described for men compared to women (Rugge, Fassan, &
Graham, 2015). This difference has been attributed to the effect of estrogens, which is reinforced as
the difference in risk between genders declines after 60 years of age, suggesting a loss of the
hormonal protective effect in the postmenopausal years, which can be modified as by the use of
hormonal replacement therapy (Camargo et al., 2012; Sipponen & Correa, 2002; Z. Wang et al., 2016).
As we studied a lesion placed in the beginning of the precancerous cascade in an elderly population,
it is not surprising that the difference between both sexes is lost upon the diminution of estrogen
exposure in elderly women. Information about reproductive periods and use of hormonal
replacement therapy was not available, so this hypothesis could not be tested for this study.
The adjusted model also showed consistency when tested in the two age groups (younger and older
than 80 years). Intestinal-type gastric cancer is normally develop during a long period of time and
the risk for disease gradually increases with age, reaching a plateau between 55 and 80 years (Rugge
et al., 2015). Theoretically, according to age, the studied population would have already developed
cancer or advanced preneoplastic lesions and being older than 80 years should be a changing factor
in the carcinogenic process.
The most important change in the model was observed when subjects were separated in groups
according to geographical risk areas for gastric cancer. In this case, the structure of the model was
maintained but the magnitude of the effect of CagA in the PG ratio in the individuals from high-risk
zones was twice as high as those for people from medium- and low-risk areas. There may be a
difference amongst the CagA types present in the circulating strains in the different zones. There are
three types of Western CagA proteins, that differ in the number of tyrosine phosphorylation motifs
Glu-Pro-Ile-Tyr-Ala (EPIYA) (Higashi, Tsutsumi, Fujita, et al., 2002). The variations alter the
phosphorylation degree of CagA and its biological activity, and in consequence, the clinical outcome
of the infection (Argent et al., 2004; Ferreira, Machado, Leite, Carneiro, & Figueiredo, 2012; Nagase,
Hayashi, Senda, & Hatakeyama, 2015). The specific analysis of the CagA types was not performed in
this study as it requires the isolates of H. pylori, but the increased magnitude of the CagA effect
highlights the importance of analyzing this feature between high- and low-risk populations in Costa
Rica.
Gabriel Molina-Castro, Stefany Matarrita-Muñoz, Silvia Elena Molina-Castro, Ericka Méndez-
Chacón, Clas Une, Vanessa Ramírez-MayorgaDoi: https://doi.org/10.15517/psm.v0i19.48113
Volumen 19, número 2, Art. Cient. enero-junio 2022
6. Conclusions
In conclusion, we showed that good fit was obtained for the proposed SEM model considering
PGI/PGII ratio, H. pylori-CagA and environmental factors such as caloric intake, obesity, and harmful
habits, shedding light on the possible relationships between them in the study of elderly people
from Costa Rica. Findings from this study are preliminary and should be interpreted with caution.
However, results seem to indicate that relationship between CagA and PG ratio increases with the
geographical risk area level for elderly people, reinforcing the pertinence of serum PG levels as a
non-invasive test to evaluate the presence of increased gastric cancer risk. No relationship
differences were observed on measures relationships between male and female population, or
between under 80 years and older individuals. The results obtained in this study may be relevant for
the assessment of gastric atrophy and gastric cancer processes in elderly people. Further studies are
recommended, considering a deeper analysis of CagA types, its relationship with PG ratio and
younger individuals where age and sex differences may have stronger influence in measures
relationships.
7. Acknowledgements
The authors would like to thank Dr. Eiliana Montero-Rojas (School of Statistics, UCR) for her valuable
guidance on the topic and general review of the manuscript. The project "Costa Rica: Longevity and
Healthy Aging Study” (CRELES, for its Spanish acronym) is a research project of the University of
Costa Rica (Project No. 828-A4-325) executed by the Central American Center of Population (CCP)
with the collaboration of the Institute for Health Research (INISA) and with a grant from the
Wellcome Trust Foundation (Grant N. 072406/Z/03/Z). Main researcher: Luis Rosero-Bixby. Co-
researcher: Xinia Fernández and William H. Dow. Collaborating researchers: Ericka Méndez, Guido
Pinto, Hannia Campos, Kenia Barrantes, Floribeth Fallas, Alberto Cubero, Gilbert Brenes, Carolina
Rivera, and Melissa Rodríguez. The project “Blood pepsinogen levels to identify people at high risk
of gastric cancer in an adult Costa Rican population” is a research project of the University of Costa
Rica (Project No. 742-A6-318) executed by the Institute for Health Research (INISA). Main researcher:
Clas Une.
Conflict of Interest: The authors declare that there is no conflict of interests.
Financial disclosure statement: This study was supported by research grants from the University of
Costa Rica and the Ministry of Science and Technology (MICIT-CONICIT), Costa Rica.
Gabriel Molina-Castro, Stefany Matarrita-Muñoz, Silvia Elena Molina-Castro, Ericka Méndez-
Chacón, Clas Une, Vanessa Ramírez-MayorgaDoi: https://doi.org/10.15517/psm.v0i19.48113
Volumen 19, número 2, Art. Cient. enero-junio 2022
8. References
Aguirre, A., Botina, N., y Botero, Y. (2018). Representaciones sociales en víctimas de la violencia por
conflicto armado. Criterio Libre Jurídico, 15(1), 162-173.
Alpízar-Alpízar, W., Pérez-Pérez, G. I., Une, C., Cuenca, P., & Sierra, R. (2005). Association of
interleukin-1B and interleukin-1RN polymorphisms with gastric cancer in a high-risk
population of Costa Rica. Clin Exp Med, 5(4), 169-176. doi:10.1007/s10238-005-0082-3
Argent, R. H., Kidd, M., Owen, R. J., Thomas, R. J., Limb, M. C., & Atherton, J. C. (2004). Determinants
and consequences of different levels of CagA phosphorylation for clinical isolates of
Helicobacter pylori. Gastroenterology, 127(2), 514-523. doi:S001650850401025X [pii]
Atherton, J. C. (2006). The pathogenesis of Helicobacter pylori-induced gastro-duodenal diseases.
Annu Rev Pathol, 1, 63-96. doi:10.1146/annurev.pathol.1.110304.100125
Atherton, J. C., Cao, P., Peek, R. M., Tummuru, M. K., Blaser, M. J., & Cover, T. L. (1995). Mosaicism in
vacuolating cytotoxin alleles of Helicobacter pylori. Association of specific vacA types with
cytotoxin production and peptic ulceration. J Biol Chem, 270(30), 17771-17777.
Azevedo, N. F., Huntington, J., & Goodman, K. J. (2009). The epidemiology of Helicobacter pylori and
public health implications. Helicobacter, 14 Suppl 1, 1-7. doi:10.1111/j.1523-
5378.2009.00703.x
Blanco-Delgado, C. A., Rivera, P., Hernández, F., Hevia, F., Guillén, F., Durán, S., & Miranda, M. (2001).
Prevalencia de Helicobacter pylori en pacientes atendidos en el Hospital San Juan de Dios, San
José, Costa Rica. Revista Biomédica, 12, 1-4.
Blaser, M. J., Perez-Perez, G. I., Kleanthous, H., Cover, T. L., Peek, R. M., Chyou, P. H., . . . Nomura, A.
(1995a). Infection with Helicobacter pylori strains possessing cagA is associated with an
increased risk of developing adenocarcinoma of the stomach. Cancer Res, 55(10), 2111-2115.
Blaser, M. J., Perez-Perez, G. I., Kleanthous, H., Cover, T. L., Peek, R. M., Chyou, P. H., . . . Nomura, A.
(1995b). Infection with Helicobacter pylori strains possessing cagA is associated with an
increased risk of developing adenocarcinoma of the stomach. Cancer Res, 55(10), 2111-2115.
Bray, F., Ferlay, J., Soerjomataram, I., Siegel, R. L., Torre, L. A., & Jemal, A. (2018). Global cancer
statistics 2018: GLOBOCAN estimates of incidence and mortality worldwide for 36 cancers in
185 countries. CA Cancer J Clin, 68(6), 394-424. doi:10.3322/caac.21492
Gabriel Molina-Castro, Stefany Matarrita-Muñoz, Silvia Elena Molina-Castro, Ericka Méndez-
Chacón, Clas Une, Vanessa Ramírez-MayorgaDoi: https://doi.org/10.15517/psm.v0i19.48113
Volumen 19, número 2, Art. Cient. enero-junio 2022
Brenes-Camacho, G., & Rosero-Bixby, L. (2008). Metabolic control in a nationally representative
diabetic elderly sample in Costa Rica: patients at community health centers vs. patients at
other health care settings. BMC Int Health Hum Rights, 8, 5. doi:10.1186/1472-698X-8-5
Brenner, H., Rothenbacher, D., & Weck, M. N. (2007). Epidemiologic findings on serologically defined
chronic atrophic gastritis strongly depend on the choice of the cutoff-value. Int J Cancer,
121(12), 2782-2786. doi:10.1002/ijc.22992
Burucoa, C., & Axon, A. (2017). Epidemiology of Helicobacter pylori infection. Helicobacter, 22 Suppl
1. doi:10.1111/hel.12403
Camargo, M. C., Goto, Y., Zabaleta, J., Morgan, D. R., Correa, P., & Rabkin, C. S. (2012). Sex hormones,
hormonal interventions, and gastric cancer risk: a meta-analysis. Cancer Epidemiol Biomarkers
Prev, 21(1), 20-38. doi:10.1158/1055-9965.epi-11-0834
Cao, Q., Ran, Z. H., & Xiao, S. D. (2007). Screening of atrophic gastritis and gastric cancer by serum
pepsinogen, gastrin-17 and Helicobacter pylori immunoglobulin G antibodies. J Dig Dis, 8(1),
15-22. doi:10.1111/j.1443-9573.2007.00271.x
Con, S. A., Valerín, A. L., Takeuchi, H., Con-Wong, R., Con-Chin, V. G., Con-Chin, G. R., . . . Araki, K.
(2006). Helicobacter pylori CagA status associated with gastric cancer incidence rate variability
in Costa Rican regions. J Gastroenterol, 41(7), 632-637. doi:10.1007/s00535-006-1812-3
Correa, P. (1992). Human gastric carcinogenesis: a multistep and multifactorial process--First
American Cancer Society Award Lecture on Cancer Epidemiology and Prevention. Cancer Res,
52(24), 6735-6740.
Correa, P., & Piazuelo, M. B. (2012). The gastric precancerous cascade. J Dig Dis, 13(1), 2-9.
doi:10.1111/j.1751-2980.2011.00550.x
Covacci, A., Censini, S., Bugnoli, M., Petracca, R., Burroni, D., Macchia, G., . . . Figura, N. (1993).
Molecular characterization of the 128-kDa immunodominant antigen of Helicobacter pylori
associated with cytotoxicity and duodenal ulcer. Proc Natl Acad Sci U S A, 90(12), 5791-5795.
Cover, T. L., & Blaser, M. J. (1992). Purification and characterization of the vacuolating toxin from
Helicobacter pylori. J Biol Chem, 267(15), 10570-10575.
Crew, K. D., & Neugut, A. I. (2006). Epidemiology of gastric cancer. World J Gastroenterol, 12(3), 354-
362.
Gabriel Molina-Castro, Stefany Matarrita-Muñoz, Silvia Elena Molina-Castro, Ericka Méndez-
Chacón, Clas Une, Vanessa Ramírez-MayorgaDoi: https://doi.org/10.15517/psm.v0i19.48113
Volumen 19, número 2, Art. Cient. enero-junio 2022
Dinis-Ribeiro, M., Yamaki, G., Miki, K., Costa-Pereira, A., Matsukawa, M., & Kurihara, M. (2004). Meta-
analysis on the validity of pepsinogen test for gastric carcinoma, dysplasia or chronic atrophic
gastritis screening. J Med Screen, 11(3), 141-147. doi:10.1258/0969141041732184
El-Omar, E. M., Carrington, M., Chow, W. H., McColl, K. E., Bream, J. H., Young, H. A., . . . Rabkin, C. S.
(2000). Interleukin-1 polymorphisms associated with increased risk of gastric cancer. Nature,
404(6776), 398-402. doi:10.1038/35006081
Ferlay, J., Colombet, M., Soerjomataram, I., Mathers, C., Parkin, D. M., Pineros, M., . . . Bray, F. (2018).
Estimating the global cancer incidence and mortality in 2018: GLOBOCAN sources and
methods. Int J Cancer. doi:10.1002/ijc.31937
Ferreira, R. M., Machado, J. C., Leite, M., Carneiro, F., & Figueiredo, C. (2012). The number of
Helicobacter pylori CagA EPIYA C tyrosine phosphorylation motifs influences the pattern of
gastritis and the development of gastric carcinoma. Histopathology, 60(6), 992-998.
doi:10.1111/j.1365-2559.2012.04190.x
Ferrer-Ferrer, M., Malespín-Bendaña, W., Ramírez, V., González, M. I., Carvajal, A., & Une, C. (2013).
Polymorphisms in genes coding for HSP-70 are associated with gastric cancer and duodenal
ulcer in a population at high risk of gastric cancer in Costa Rica. Arch Med Res, 44(6), 467-474.
doi:10.1016/j.arcmed.2013.08.008
Fox, J. G., Dangler, C. A., Taylor, N. S., King, A., Koh, T. J., & Wang, T. C. (1999). High-salt diet induces
gastric epithelial hyperplasia and parietal cell loss, and enhances Helicobacter pylori
colonization in C57BL/6 mice. Cancer Res, 59(19), 4823-4828.
GLOBOCAN. (2012). Stomach Cancer Incidence and Mortality Worldwide in 2012.
Graham, D. Y. (1997). Helicobacter pylori infection in the pathogenesis of duodenal ulcer and gastric
cancer: a model. Gastroenterology, 113(6), 1983-1991.
Hatakeyama, M. (2003). Helicobacter pylori CagA as a potential bacterial oncoprotein in gastric
carcinogenesis. Pathol Biol (Paris), 51(7), 393-394.
Hatakeyama, M. (2004). Oncogenic mechanisms of the Helicobacter pylori CagA protein. Nat Rev
Cancer, 4(9), 688-694. doi:nrc1433 [pii] 10.1038/nrc1433
Hays, R. D., Revicki, D., & Coyne, K. S. (2005). Application of structural equation modeling to health
outcomes research. In Eval Health Prof (Vol. 28, pp. 295-309). United States.
Gabriel Molina-Castro, Stefany Matarrita-Muñoz, Silvia Elena Molina-Castro, Ericka Méndez-
Chacón, Clas Une, Vanessa Ramírez-MayorgaDoi: https://doi.org/10.15517/psm.v0i19.48113
Volumen 19, número 2, Art. Cient. enero-junio 2022
Higashi, H., Nakaya, A., Tsutsumi, R., Yokoyama, K., Fujii, Y., Ishikawa, S., . . . Hatakeyama, M. (2004).
Helicobacter pylori CagA induces Ras-independent morphogenetic response through SHP-2
recruitment and activation. J Biol Chem, 279(17), 17205-17216. doi:10.1074/jbc.M309964200
Higashi, H., Tsutsumi, R., Fujita, A., Yamazaki, S., Asaka, M., Azuma, T., & Hatakeyama, M. (2002).
Biological activity of the Helicobacter pylori virulence factor CagA is determined by variation
in the tyrosine phosphorylation sites. Proc Natl Acad Sci U S A, 99(22), 14428-14433.
doi:10.1073/pnas.222375399
Higashi, H., Tsutsumi, R., Muto, S., Sugiyama, T., Azuma, T., Asaka, M., & Hatakeyama, M. (2002). SHP-
2 tyrosine phosphatase as an intracellular target of Helicobacter pylori CagA protein. Science,
295(5555), 683-686. doi:10.1126/science.1067147
Hox, J., & Bechger, T. (1999). An Introduction to Structural Equation Modeling. Family Science Review,
11.
Hox, J., Moerbeek, M., & van de Schoot, R. (2010). Multilevel Analysis: Techniques and Applications
(Second edition ed.). New York: Routlegde.
Jayalekshmi, P. A., Hassani, S., Nandakumar, A., Koriyama, C., Sebastian, P., & Akiba, S. (2015). Gastric
cancer risk in relation to tobacco use and alcohol drinking in Kerala, India--Karunagappally
cohort study. World J Gastroenterol, 21(44), 12676-12685. doi:10.3748/wjg.v21.i44.12676
Kabagambe, E. K., Baylin, A., Allan, D. A., Siles, X., Spiegelman, D., & Campos, H. (2001). Application
of the method of triads to evaluate the performance of food frequency questionnaires and
biomarkers as indicators of long-term dietary intake. Am J Epidemiol, 154(12), 1126-1135.
Kaplan, D. (2008). Structural Equation Modeling: Foundations and Extensions: SAGE Publications.
Kayali, S., Manfredi, M., Gaiani, F., Bianchi, L., Bizzarri, B., Leandro, G., . . . De' Angelis, G. L. (2018).
Helicobacter pylori, transmission routes and recurrence of infection: state of the art. Acta
Biomed, 89(8-s), 72-76. doi:10.23750/abm.v89i8-S.7947
Kuipers, E. J., Pérez-Pérez, G. I., Meuwissen, S. G., & Blaser, M. J. (1995). Helicobacter pylori and
atrophic gastritis: importance of the cagA status. J Natl Cancer Inst, 87(23), 1777-1780.
Lu, H., Yamaoka, Y., & Graham, D. Y. (2005). Helicobacter pylori virulence factors: facts and fantasies.
Curr. Opin. Gastroenterol., 21, 653-659.
Gabriel Molina-Castro, Stefany Matarrita-Muñoz, Silvia Elena Molina-Castro, Ericka Méndez-
Chacón, Clas Une, Vanessa Ramírez-MayorgaDoi: https://doi.org/10.15517/psm.v0i19.48113
Volumen 19, número 2, Art. Cient. enero-junio 2022
Malfertheiner, P., Chan, F. K., & McColl, K. E. (2009). Peptic ulcer disease. Lancet, 374(9699), 1449-
1461. doi:10.1016/s0140-6736(09)60938-7
Marshall, B. J. (1986). Campylobacter pyloridis and gastritis. J Infect Dis, 153(4), 650-657.
Marshall, B. J., & Warren, J. R. (1984). Unidentified curved bacilli in the stomach of patients with
gastritis and peptic ulceration. Lancet, 1(8390), 1311-1315.
Menaker, R. J., Sharaf, A. A., & Jones, N. L. (2004). Helicobacter pylori infection and gastric cancer:
host, bug, environment, or all three? Curr Gastroenterol Rep, 6(6), 429-435.
Miranda, M., Chaves, M., San Román, M., Durán, S., Vargas, G., Jiménez , E., . . . Barrantes, E. (1998).
La relación de Helicobacter pylori con la displasia y el cáncer gástrico en Costa Rica. Revista
de Biología Tropical, 46(3), 829-832.
Montero, E. (2012). Los modelos de ecuaciones estructurales como herramienta para explorar
posibles relaciones causales en investigación educativa: Una ilustración con datos de PISA
2009 en Costa Rica. In.
Murata-Kamiya, N. (2011). Pathophysiological functions of the CagA oncoprotein during infection
by Helicobacter pylori. Microbes Infect, 13(10), 799-807. doi:10.1016/j.micinf.2011.03.011
Nagase, L., Hayashi, T., Senda, T., & Hatakeyama, M. (2015). Dramatic increase in SHP2 binding
activity of Helicobacter pylori Western CagA by EPIYA-C duplication: its implications in gastric
carcinogenesis. Sci Rep, 5, 15749. doi:10.1038/srep15749
Neel, B. G., Gu, H., & Pao, L. (2003). The 'Shp'ing news: SH2 domain-containing tyrosine phosphatases
in cell signaling. Trends Biochem Sci, 28(6), 284-293. doi:10.1016/S0968-0004(03)00091-4
Ohnishi, N., Yuasa, H., Tanaka, S., Sawa, H., Miura, M., Matsui, A., . . . Hatakeyama, M. (2008).
Transgenic expression of Helicobacter pylori CagA induces gastrointestinal and
hematopoietic neoplasms in mouse. Proc Natl Acad Sci U S A, 105(3), 1003-1008.
doi:10.1073/pnas.0711183105
Perez-Perez, G. I., Dworkin, B. M., Chodos, J. E., & Blaser, M. J. (1988). Campylobacter pylori antibodies
in humans. Ann Intern Med, 109(1), 11-17.
Persson, C., Jia, Y., Pettersson, H., Dillner, J., Nyrén, O., & Ye, W. (2011). H. pylori seropositivity before
age 40 and subsequent risk of stomach cancer: a glimpse of the true relationship? PLoS One,
6(3), e17404. doi:10.1371/journal.pone.0017404
Gabriel Molina-Castro, Stefany Matarrita-Muñoz, Silvia Elena Molina-Castro, Ericka Méndez-
Chacón, Clas Une, Vanessa Ramírez-MayorgaDoi: https://doi.org/10.15517/psm.v0i19.48113
Volumen 19, número 2, Art. Cient. enero-junio 2022
Polk, D. B., & Peek, R. M. (2010). Helicobacter pylori: gastric cancer and beyond. Nat Rev Cancer,
10(6), 403-414. doi:nrc2857 [pii]
10.1038/nrc2857
Qadri, Q., Rasool, R., Gulzar, G. M., Naqash, S., & Shah, Z. A. (2014). H. pylori infection, inflammation
and gastric cancer. J Gastrointest Cancer, 45(2), 126-132. doi:10.1007/s12029-014-9583-1
Rugge, M., Fassan, M., & Graham, D. Y. (2015). Epidemiology of Gastric Cancer. In V. E. Strong (Ed.),
Gastric Cancer. Principles and practice (pp. 23-34). Switzerland: Springer.
Ruiz, M., Pardo, A., & San Martín, R. (2010). MODELOS DE ECUACIONES
ESTRUCTURALES. Papeles del Psicólogo, 31(1), 34-45.
Shichijo, S., Hirata, Y., Niikura, R., Hayakawa, Y., Yamada, A., & Koike, K. (2017). Association between
gastric cancer and the Kyoto classification of gastritis. J Gastroenterol Hepatol, 32(9), 1581-
1586. doi:10.1111/jgh.13764
Sierra, R., Mena, F., Ramírez, V., Méndez, E., Salazar, M., Une, C., & Kajiwara, T. (2003). Pepsinógenos
séricos para detectar cáncer gástrico en Costa Rica. Acta Bioquímica Clínica Latinoamericana,
37(4), 357-362.
Sierra, R., Muñoz, N., Peña, A. S., Biemond, I., van Duijn, W., Lamers, C. B., . . . Correa, P. (1992).
Antibodies to Helicobacter pylori and pepsinogen levels in children from Costa Rica:
comparison of two areas with different risks for stomach cancer. Cancer Epidemiol Biomarkers
Prev, 1(6), 449-454.
Sierra, R., Une, C., Ramirez, V., Alpizar-Alpizar, W., Gonzalez, M. I., Ramirez, J. A., . . . Megraud, F.
(2008). Relation of atrophic gastritis with Helicobacter pylori-CagA(+) and interleukin-1 gene
polymorphisms. World J Gastroenterol, 14(42), 6481-6487.
Sierra, R., Une, C., Ramírez, V., González, M. I., Ramírez, J. A., de Mascarel, A., . . . Mégraud, F. (2006).
Association of serum pepsinogen with atrophic body gastritis in Costa Rica. Clin Exp Med, 6(2),
72-78. doi:10.1007/s10238-006-0098-3
Sigarán, M. F., Hernández, F., Rivera, P., Miranda M, J., Aguilar O, M., & Rodríguez J, O. (1992).
Incidencia del Helicobacter pylori en la consulta endoscópica de un hospital costarricense.
Patología, 30(1), 15-19.
Gabriel Molina-Castro, Stefany Matarrita-Muñoz, Silvia Elena Molina-Castro, Ericka Méndez-
Chacón, Clas Une, Vanessa Ramírez-MayorgaDoi: https://doi.org/10.15517/psm.v0i19.48113
Volumen 19, número 2, Art. Cient. enero-junio 2022
Sipponen, P., & Correa, P. (2002). Delayed rise in incidence of gastric cancer in females results in
unique sex ratio (M/F) pattern: etiologic hypothesis. Gastric Cancer, 5(4), 213-219.
doi:10.1007/s101200200037
Sipponen, P., Härkönen, M., Alanko, A., & Suovaniemi, O. (2003). Diagnosis of atrophic gastritis from
a serum sample. Minerva Gastroenterol Dietol, 49(1), 11-21.
Sipponen, P., Samloff, I. M., Saukkonen, M., & Varis, K. (1985). Serum pepsinogens I and II and gastric
mucosal histology after partial gastrectomy. Gut, 26(11), 1179-1182.
Smolka, A. J., & Schubert, M. L. (2017). Helicobacter pylori-Induced Changes in Gastric Acid Secretion
and Upper Gastrointestinal Disease. Curr Top Microbiol Immunol, 400, 227-252.
doi:10.1007/978-3-319-50520-6_10
Song, J. H., Kim, S. G., Jin, E. H., Lim, J. H., & Yang, S. Y. (2017). Risk Factors for Gastric Tumorigenesis
in Underlying Gastric Mucosal Atrophy. Gut Liver, 11(5), 612-619. doi:10.5009/gnl16488
StataCorp. (2015). Stata Statistical Software: Release 14 . . College Station, TX: StataCorp LP.
Taguchi, A., Ohmiya, N., Shirai, K., Mabuchi, N., Itoh, A., Hirooka, Y., . . . Goto, H. (2005). Interleukin-8
promoter polymorphism increases the risk of atrophic gastritis and gastric cancer in Japan.
Cancer Epidemiol Biomarkers Prev, 14(11 Pt 1), 2487-2493. doi:14/11/2487 [pii] 10.1158/1055-
9965.EPI-05-0326
Tsutsumi, R., Takahashi, A., Azuma, T., Higashi, H., & Hatakeyama, M. (2006). Focal adhesion kinase
is a substrate and downstream effector of SHP-2 complexed with Helicobacter pylori CagA.
Mol Cell Biol, 26(1), 261-276. doi:10.1128/MCB.26.1.261-276.2006
Wang, F., Meng, W., Wang, B., & Qiao, L. (2014). Helicobacter pylori-induced gastric inflammation
and gastric cancer. Cancer Lett, 345(2), 196-202. doi:10.1016/j.canlet.2013.08.016
Wang, Z., Butler, L. M., Wu, A. H., Koh, W. P., Jin, A., Wang, R., & Yuan, J. M. (2016). Reproductive
factors, hormone use and gastric cancer risk: The Singapore Chinese Health Study. Int J
Cancer, 138(12), 2837-2845. doi:10.1002/ijc.30024
Wen, S., & Moss, S. F. (2009). Helicobacter pylori virulence factors in gastric carcinogenesis. Cancer
Lett, 282(1), 1-8. doi:S0304-3835(08)00909-9 [pii]
10.1016/j.canlet.2008.11.016
Wroblewski, L. E., Peek, R. M., & Wilson, K. T. (2010). Helicobacter pylori and gastric cancer: factors
that modulate disease risk. Clin Microbiol Rev, 23(4), 713-739. doi:23/4/713 [pii]
10.1128/CMR.00011-10
Gabriel Molina-Castro, Stefany Matarrita-Muñoz, Silvia Elena Molina-Castro, Ericka Méndez-
Chacón, Clas Une, Vanessa Ramírez-MayorgaTambién puede leer