2021 Weekly / Semanal - PAHO
←
→
Transcripción del contenido de la página
Si su navegador no muestra la página correctamente, lea el contenido de la página a continuación

2021
                  Weekly / Semanal
              Influenza Report EW 29/
            Reporte de Influenza SE 29
    Regional Update: Influenza & Other Respiratory Viruses /
  Actualización Regional: Influenza y Otros virus respiratorios

                         August 3, 2021
                       3 de agosto de 2021
                               Data as of July 30, 2021/
                            Datos hasta el 30 de julio de 2021

                      Prepared by PHE/IHM/Influenza Team/
PAHO/OPS | INFLUENZARealizado por PHE/IHM/Equipo
                    REGIONAL UPDATE                     de Influenza
                                    EW 29, 2021 /ACTUALIZACIÓN REGIONAL DE INFLUENZA SE 29 DE 2021   1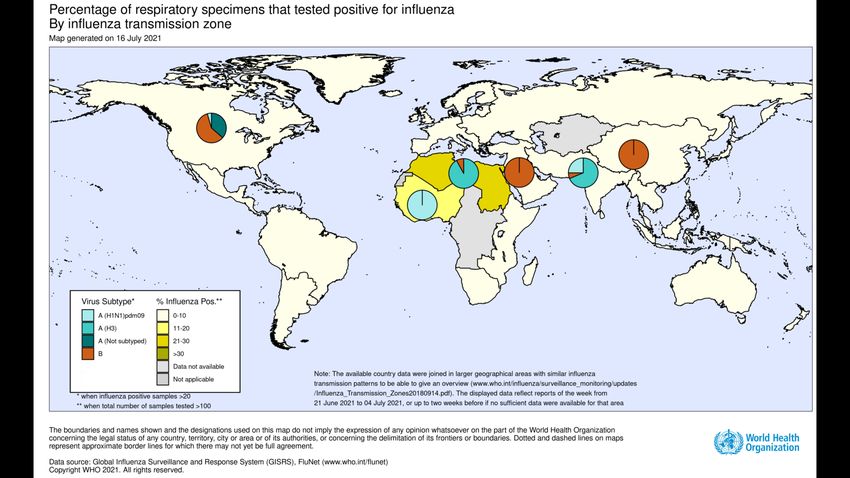
FluNet

                                                    FluID

                           Map Production /Producción del mapa: PAHO/WHO. OPS/OMS.

                           Data Source / Fuente de datos:
                           Ministries of Health and National Influenza Centers of Member States
                           Reports to the informatics global platforms FluNet and / FluID
                           Informe de los Ministerios de Salud y los Centros Nacionales de
                           Influenza de los Estados Miembros a las plataformas informáticas
                           globales de FluNet y FluID

PAHO/OPS | INFLUENZA REGIONAL UPDATE EW 29, 2021 /ACTUALIZACIÓN REGIONAL DE INFLUENZA SE 29 DE 2021   2
WEEKLY REPORT DATA SOURCES
   The information presented in this update is based on data provided by Ministries of Health and National
                  Influenza Centers of Member States to the global informatics platforms
                       http://www.who.int/influenza/gisrs_laboratory/flunet/en/
                  and http://www.who.int/influenza/surveillance_monitoring/fluid/en/;
  and reports/weekly bulletins that Ministries of Health published on its website or shared with PAHO/WHO.

La información presentada en esta actualización se obtiene a partir de los datos notificados por los Ministerios
     de Salud y los Centros Nacionales de Influenza de los Estados Miembros a las plataformas informáticas
 globales de la OPS/OMS: FluNet y FluID; y de los informes/boletines semanales que los Ministerios de Salud
                            publican en sus páginas web o comparten con OPS/OMS.

Note: Compared to the same period of the previous years, the current influenza surveillance data should be
interpreted in light of the ongoing COVID-19 pandemic, which may have influence, to differing extents, health
seeking behaviors, staffing/routines in sentinel sites, and testing capacities in Member States. The various social
and physical distancing measures implemented by Member States to reduce SARS-CoV2 virus transmission may
also have played a role in reducing substantially or even complete influenza virus transmission.

Nota: en comparación con el mismo período de los años anteriores, los datos actuales de vigilancia de la
influenza deben interpretarse a la luz de la pandemia de COVID-19 en curso, que puede tener influencia en
diferentes grados, comportamientos de búsqueda de salud, personal / rutinas en sitios centinela, y capacidades
de prueba en los Estados miembros. Las diversas medidas de distanciamiento social y físico implementadas por
los Estados Miembros para reducir la transmisión del virus SARS-CoV2 también pueden haber desempeñado un
papel en la reducción sustancial o incluso completa, en la transmisión del virus de la influenza.

                     PAHO INFLUENZA LINKS
                           PAHO interactive data / Datos interactivos de la OPS:

                               PAHO FluNet: http://ais.paho.org/phip/viz/ed_flu.asp

                            PAHO FluID: http://ais.paho.org/phip/viz/flumart2015.asp

                       Influenza regional reports / Informes regionales de influenza

                               In English: https://www.paho.org/hq/influenzareport

                                   En español: www.paho.org/reportesinfluenza

                          Severe acute respiratory infections network - SARInet
                       Red de las infecciones respiratorias agudas graves - SARInet:

                                           http://www.sarinet.org

          PAHO/OPS | INFLUENZA REGIONAL UPDATE EW 29, 2021 /ACTUALIZACIÓN REGIONAL DE INFLUENZA SE 29 DE 2021         3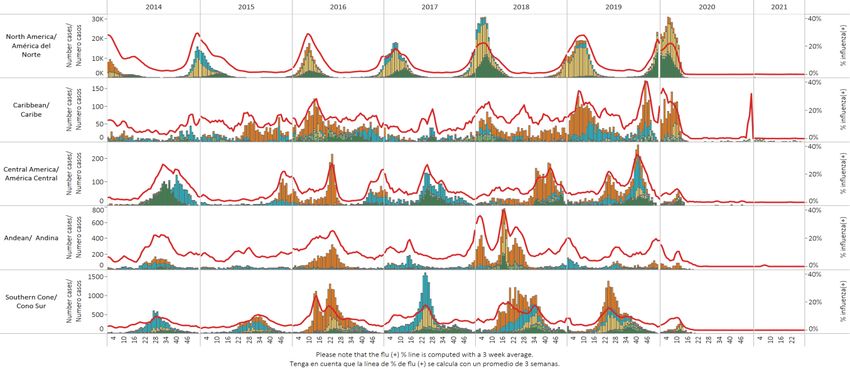
Go to Index/
                                                                                                                       Ir al Índice
Report Index / Índice
    del informe

                                         REPORT INDEX
                                  ÍNDICE DE LA ACTUALIZACIÓN

                        Section                                            Content                                            Page

                          1                               Weekly Summary / Resumen Semanal                                       5

                          2           Influenza Global Update 399/ Actualización de influenza a nivel mundial 399                7

                                         Overall Influenza and RSV circulation / Circulación general de los virus
                          3                                                                                                      9
                                                                    influenza y VRS
                                      Overall ORV circulation and antigenic characterization of influenza viruses,
                          4          2017-20 / Circulación general de OVR y caracterización antigénica de los virus             10
                                                                  influenza, 2017-20

                          5              Weekly and Cumulative numbers / Números semanales y acumulados                         11

                                            Epidemiological and Virologic updates by country / Actualización
                          6                                                                                                     12
                                                         epidemiológica y virológica por país

                          7                                        Acronyms / Acrónimos                                         36

                                  PAHO/OPS | INFLUENZA REGIONAL UPDATE EW 29, 2021 /ACTUALIZACIÓN REGIONAL DE INFLUENZA SE 29 DE 2021   4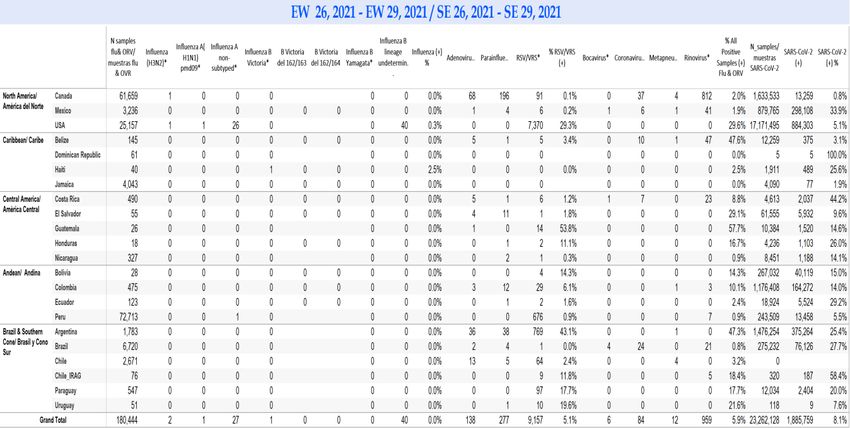
Resumen del informe
Report Summaries –

                                                    WEEKLY SUMMARY (ENGLISH)

                      North America: Influenza activity remained at baseline levels, with influenza A and B equally detected. Overall, SARS-CoV-
                      2 activity continued at moderate levels, and in Mexico and the United States SARS-CoV-2 detections continued elevated.
                      RVS activity continued to increase in the United States.

                      Caribbean: Influenza activity remained low. SARS-CoV-2 activity continued to decrease and in Belize and Haiti, SARS-CoV-
                      2 activity slightly decreased.

                      Central America: Influenza activity remained low. Overall, SARS-CoV-2 activity continued at moderate levels in Costa Rica,
                      Honduras and Nicaragua. In El Salvador, Honduras and Guatemala SARS-CoV-2 and RSV co-circulated.

                      Andean: Influenza activity remained low. Overall, SARS-CoV-2 activity continued elevated in Bolivia and Colombia.

                      Brazil and Southern Cone: Influenza activity remained low. Overall, SARS-CoV-2 activity was elevated with decreasing trend
                      in the subregion but elevated in Chile; and in Argentina, Paraguay, and Uruguay RSV activity remained at high levels.

                      Global: Despite continued or even increased testing for influenza in some countries, influenza activity remained at lower
                      levels than expected for this time of the year. In the temperate zone of the southern hemisphere, influenza activity
                      remained at inter-seasonal levels. In the temperate zone of the northern hemisphere, influenza activity remained at inter-
                      seasonal levels. In tropical Africa, a few influenza detections were reported in some countries in Western and Eastern
                      Africa. In Southern Asia, a few influenza detections were reported from India and Nepal. In southeast Asia, a few detections
                      of Influenza A (H3) and Influenza B (Victoria) were reported from the Philippines and Thailand. Worldwide, influenza B
                      detections accounted for the majority of the low number of detections reported.

                                 PAHO/OPS | INFLUENZA REGIONAL UPDATE EW 29, 2021 /ACTUALIZACIÓN REGIONAL DE INFLUENZA SE 29 DE 2021                 5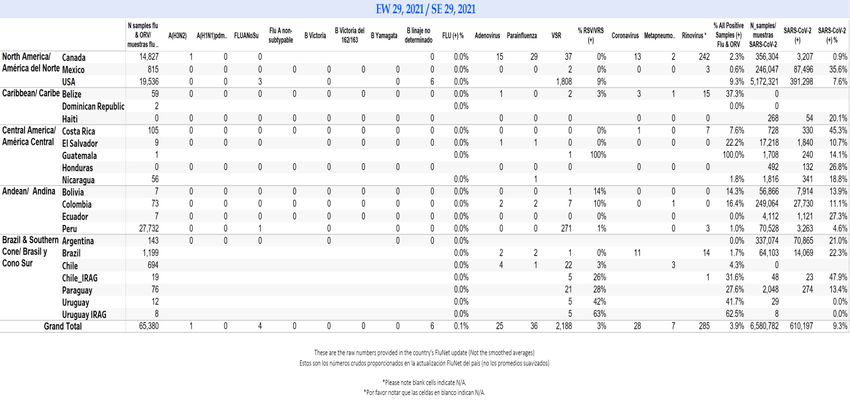
Resumen del informe
Report Summaries –

                                                   RESUMEN SEMANAL (ESPAÑOL)

                      América del Norte: la actividad de la influenza se mantuvo baja con influenza A y B igualmente detectados. En general, la
                      actividad de SARS-CoV-2 continuó en niveles moderados y en México y los Estados Unidos, las detecciones de SARS-CoV-
                      2 continuaron elevadas. La actividad del VRS continuó amentando en los Estados Unidos.

                      Caribe: la actividad de la influenza se mantuvo baja. La actividad de SARS-CoV-2 continuó en descenso y en Belice y Haití,
                      la actividad de SARS-CoV-2 disminuyó ligeramente.

                      América Central: la actividad de la influenza se mantuvo baja. En general, la actividad del SARS-CoV-2 continuó en niveles
                      moderados en Costa Rica, Honduras y en Nicaragua y en El Salvador, Honduras y Guatemala circularon concurrentemente
                      los virus SARS-CoV-2 y VRS.

                      Andina: la actividad de la influenza se mantuvo baja. En general, la actividad del SARS-CoV-2 continuó elevada en Bolivia y
                      Colombia.

                      Brasil y Cono Sur: la actividad de la influenza se mantuvo baja. En general, la actividad de SARS-CoV-2 fue elevada con
                      tendencia al descenso en la subregión, aunque elevada en Chile y en Argentina, Paraguay y Uruguay la actividad del VRS
                      permaneció en niveles elevados.

                      Global: a pesar de que la realización de pruebas para la detección de influenza continuó o incluso aumentó en algunos
                      países, la actividad del virus de la influenza se mantuvo en niveles más bajos de lo esperado para esta época del año. En la
                      zona templada del hemisferio sur, la actividad del virus de la influenza se mantuvo en niveles interestacionales. En la zona
                      templada del hemisferio norte, la actividad del virus de la influenza se mantuvo en niveles interestacionales. En África
                      tropical, se notificaron algunas detecciones de influenza en algunos países de África occidental y oriental. En el sur de Asia,
                      se informaron algunas detecciones de influenza en India y Nepal. En el sureste de Asia, se informaron algunas detecciones
                      de influenza A (H3) e influenza B (Victoria) en Filipinas y Tailandia. A nivel mundial, las detecciones de influenza B
                      representaron la mayoría del bajo número de detecciones reportadas.

                                 PAHO/OPS | INFLUENZA REGIONAL UPDATE EW 29, 2021 /ACTUALIZACIÓN REGIONAL DE INFLUENZA SE 29 DE 2021                    6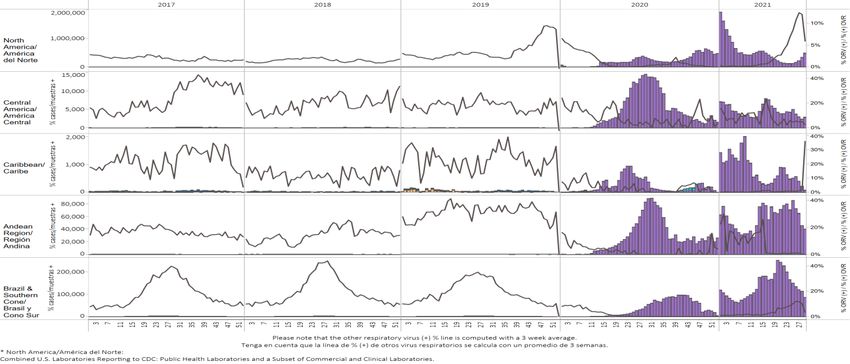
Influenza Global Update 399 / Actualización de influenza a nivel mundial 399
                                                                2 August 2021 / 2 de agosto de 2021
                                           Based on data up to July 18, 2021 / basado en datos hasta el 18 de julio de 2021

                       In the temperate zones of the southern hemisphere, influenza activity remained at inter-seasonal levels. In Oceania, influenza-like illness
                       (ILI) and other influenza activity indicators remained low despite continued testing. In New Zealand, RSV is still the most commonly
                       detected virus among SARI cases. In South Africa, sporadic detections of influenza B viruses (lineage not determined) were reported in this
                       period, although activity remains at inter-seasonal levels. Respiratory syncytial virus (RSV) detections continued to be registered. In
                       Western Africa, influenza A(H1N1)pdm09 and H3 viruses were reported in Côte d’Ivoire. One influenza A virus (not subtyped) was reported
                       in Nigeria. From Middle Africa, no reports were received for this reporting period. In Eastern Africa, H3 viruses were detected in Ethiopia
Nivel Mundial
Global Level /

                       and Uganda. Influenza B viruses (lineage not determined) were detected in Kenya. In Southern Asia, influenza detections of predominantly
                       A(H3N2) virus were reported from India and Nepal. In addition, few influenza A(H1N1)pdm09 (India) and influenza B (Victoria lineage)
                       virus detections (Nepal) were reported, Bangladesh reported influenza B (Victoria) detections for previous weeks. In southeast Asia,
                       influenza A(H3N2) and B detections (Victoria lineage) were reported from the Philippines and influenza A(H3N2) detections from Thailand.
                       In the temperate zones of the northern hemisphere, influenza activity remained below baseline overall. In Europe, influenza activity
                       remained at inter-seasonal levels, with only a few detections of influenza A and B viruses reported from Denmark, the Russian Federation,
                       Sweden, and the UK. Detections of other respiratory viruses continued to be reported in some countries performing surveillance for ORVs.
                       For Northern Africa, no reports were received for this reporting period. In Western Asia, influenza activity and ILI rates remained low
                       overall. Saudi Arabia reported a few influenza B detections. In East Asia, influenza illness indicators and influenza activity remained low.
                       During this period, reported detections of influenza B/Victoria lineage virus decreased in northern and southern China compared to the
                       previous reporting period and were low compared to previous years. Hospitalizations due to pneumonia have increased in recent weeks
                       in Mongolia./ En las zonas templadas del hemisferio sur, la actividad de la influenza se mantuvo en niveles interestacionales.
                       En Oceanía, la enfermedad tipo influenza (ETI) y otros indicadores de actividad de la influenza se mantuvieron bajos a pesar
                       de la realización continua de pruebas. En Nueva Zelanda, el virus respiratorio sincitial (VRS) sigue siendo el virus más
                       comúnmente detectado entre los casos de IRAG. En Sudáfrica, se informaron detecciones esporádicas de virus de influenza
                       B (linaje no determinado) en este período, aunque la actividad se mantiene en niveles interestacionales. Continuó el registro
                       de detecciones VRS. En África occidental, se notificaron los virus de influenza A(H1N1)pdm09 y H3 en Costa de Marfil. Nigeria
                       notificó la detección de virus influenza A (subtipo no determinado). De África Central, no se recibieron notificaciones para
                       este período de informe. En África oriental, se detectaron virus H3 en Etiopía y Uganda. Se detectaron virus influenza B (linaje
                       no determinado) en Kenia. En el sur de Asia, se notificaron detecciones de virus influenza predominantemente A(H3N2) en
                       India y Nepal. Además, se informaron pocas detecciones de virus influenza A(H1N1)pdm09 en India e influenza B (linaje
                       Victoria) en Nepal, Bangladesh informó detecciones de influenza B (Victoria) durante las semanas anteriores. En el sureste
                       de Asia, las detecciones de influenza A(H3N2) y B (linaje Victoria) se informaron en Filipina y detecciones de influenza
                       A(H3N2) en Tailandia. En las zonas templadas del hemisferio norte en general, la actividad de la influenza se mantuvo por
                       debajo de la línea de base. En Europa, la actividad de la influenza se mantuvo en niveles interestacionales, con solo unas
                       pocas detecciones de virus influenza A y B notificadas por Dinamarca, la Federación de Rusia, Suecia y el Reino Unido.
                       Continuó la notificación de detecciones de otros virus respiratorios en algunos países que realizan vigilancia de OVR. Para el
                       norte de África, no hubo notificaciones para este período de informe. En Asia occidental, la actividad de la influenza y las
                       tasas de ETI se mantuvieron bajas en general. Arabia Saudita informó algunas detecciones de influenza B. En el este de Asia,
                       los indicadores de enfermedad por influenza y la actividad de la influenza se mantuvieron bajos. Durante este período, las
                       detecciones notificadas de virus influenza B (linaje Victoria) disminuyeron en el norte y el sur de China en comparación con
                       el período de notificación anterior y estuvieron bajas en comparación con años anteriores. Las hospitalizaciones por
                       neumonía han aumentado en las últimas semanas en Mongolia.
                       National Influenza Centres (NICs) and other national influenza laboratories from 80 countries, areas or territories reported
                       data to FluNet for the time period from 5 July 2021 to 18 July 2021. The WHO GISRS laboratories tested more than 134 4851
                       specimens during that time period. A total of 720 specimens were positive for influenza viruses, of which 258 (35.8%) were
                       typed as influenza A and 462 (64.2%) as influenza B. Of the sub-typed influenza A viruses, 88 (37.8%) were influenza
                       A(H1N1)pdm09 and 145 (62.2%) were influenza A(H3N2). Of the characterized B viruses, all 408 (100.0%) belong to the
                       B/Victoria lineage. / Los Centros Nacionales de Influenza (NIC) y otros laboratorios nacionales de influenza de 80 países,
                       áreas o territorios reportaron sus datos a FluNet para el período comprendido entre el 5 y el 18 de julio de 2021. Los
                       laboratorios GISRS de la OMS analizaron más de 134 4851 muestras durante ese período. Un total de 720 muestras fueron
                       positivas para los virus influenza, de las cuales 258 (35,8%) se tipificaron como influenza A y 462 (64,2%) como influenza B.
                       De los virus influenza A, a los cuales se les identificó el subtipo, 88 (37,8%) fueron influenza A(H1N1)pdm09 y 145 (62,2%)
                       fueron influenza A(H3N2). De los virus B caracterizados, todos los 408 (100,0%) pertenecían al linaje Victoria.

                 1   It includes data only from countries reporting on positive and negative influenza specimens. Incluye datos únicamente de países que notifican muestras positivas y negativas para influenza.

                                      PAHO/OPS | INFLUENZA REGIONAL UPDATE EW 29, 2021 /ACTUALIZACIÓN REGIONAL DE INFLUENZA SE 29 DE 2021                                                                           7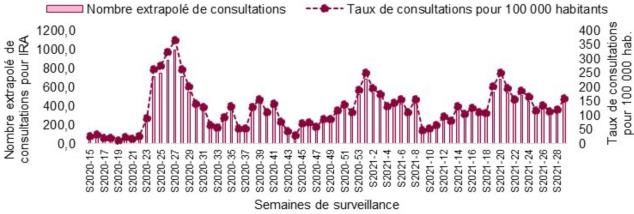
Nivel Mundial
Global Level /

                 PAHO/OPS | INFLUENZA REGIONAL UPDATE EW 29, 2021 /ACTUALIZACIÓN REGIONAL DE INFLUENZA SE 29 DE 2021   8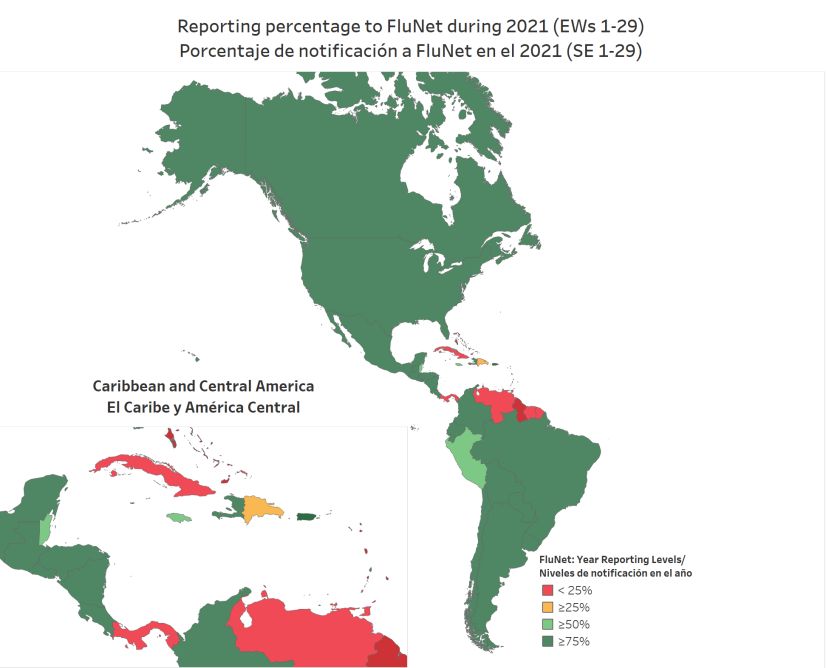
Influenza circulation by subregion, 2014-21 Circulación virus influenza por subregión, 2014-21
Resumen del informe
Report Summaries –

                      Respiratory syncytial virus (RSV) circulation                Circulación virus respiratorio sincitial (VRS)
                                 by Subregion, 2014-21                                        por subregión, 2014-21

                                      *To view more lab data, view here. / Para ver más datos de laboratorio, vea aquí.

                              PAHO/OPS | INFLUENZA REGIONAL UPDATE EW 29, 2021 /ACTUALIZACIÓN REGIONAL DE INFLUENZA SE 29 DE 2021   9
Other respiratory viruses (ORV) circulation                               Circulación de otros virus respiratorios
                                by subregion, 2017-21                                               (OVR) por subregión, 2017-21
Resumen del Reporte
Report Summaries –

                          Genetic Characterization of Influenza                                       Caracterización Genética de los Virus
                               Virus by Subregion, 2020                                                  Influenza por Subregión, 2020

                                                                            Month of data collected

                                                    *These data are from the WHO –Collaborating Center at the U.S. CDC.
                                                 *Estos datos son recolectados desde el CC de la OMS en los CDC de EE. UU.
                                               *To view more lab data, view here. / Para ver más datos de laboratorio, vea aquí.

                              PAHO/OPS | INFLUENZA REGIONAL UPDATE EW 29, 2021 /ACTUALIZACIÓN REGIONAL DE INFLUENZA SE 29 DE 2021             10
Weekly and cumulative numbers of influenza and other respiratory viruses, by country and EW, 20212,3
Números semanales y acumulados de influenza y otros virus respiratorios, por país y SE, 20214,5
Resumen del informe
Report Summaries –
2
The detection of respiratory viruses other than influenza depends on the diagnostic capacity of each country and monitoring system. The absence of report of other respiratory viruses does not indicate the absence of their circulation.
3
Data reported by the Ministries of Health of the countries, from sentinel and intensified surveillance for acute respiratory disease.
4
La detección de otros virus respiratorios diferentes a influenza depende de la capacidad diagnóstica de cada país y del sistema de vigilancia establecido. El que no se reporten otros virus respiratorios, no significa, ni indica la ausencia de circulación viral.
5
Datos reportados por los Ministerios de Salud de los países, provenientes de la vigilancia centinela e intensificada de enfermedad respiratoria aguda.
PAHO/OPS | INFLUENZA REGIONAL UPDATE EW 29, 2021 /ACTUALIZACIÓN REGIONAL DE INFLUENZA SE 29 DE 2021 11EPIDEMIOLOGIC AND VIROLOGIC ACTUALIZACIÓN EPIDEMIOLÓGICA Y
UPDATE OF INFLUENZA & OTHER VIROLÓGICA DE INFLUENZA Y OTROS
RESPIRATORY VIRUSES BY COUNTRY VIRUS RESPIRATORIOS POR PÁIS
North America / América del Norte
Canada / Canadá
• In Canada, during EW 29, few influenza detections were reported (one sample) with the circulation of the influenza
América del Norte
North America-
A(H3N2) virus. Respiratory syncytial virus (RSV) activity remained very low compared to previous seasons, with few
detections reported each week (Graphs 1 and 2). Rhinovirus, parainfluenza, and adenovirus co-circulated among
other respiratory viruses. In EW 29, SARS-CoV-2 percent positivity (0.9%) increased compared with the previously
reported. As of July 29, 2021, Ontario, Quebec, and Alberta provinces continued recording the highest cumulative
number of COVID-19 cases (Graph 3). At the national level, persons aged less than 30 years are the most affected,
with 38.4% of the patients (Graph 4). The distribution of COVID-19 cases by sex remains similar to that registered
in previous months, with 50.3% of cases in women. / En Canadá, durante la SE 29, se notificaron pocas detecciones
de influenza (una muestra) con la circulación del virus influenza A(H3N2). La actividad del virus respiratorio sincitial
(VRS) se mantuvo muy baja en comparación con temporadas anteriores, con pocas detecciones informadas cada
semana (Gráficos 1 y 2). El rinovirus, la parainfluenza y el adenovirus circularon concurrentemente entre otros virus
respiratorios. En la SE 29, el porcentaje de positividad para SARS-CoV-2 (0,9%) aumentó en comparación con lo
informado anteriormente. Al 29 de julio de 2021, las provincias de Ontario, Quebec y Alberta continuaron
registrando el mayor número acumulado de casos de COVID-19 (Gráfico 3). A nivel nacional, las personas menores
de 30 años son las más afectadas, con el 38,4% de los pacientes (Gráfico 4). La distribución de casos de COVID-19
por sexo sigue siendo similar a la registrada en meses anteriores, con un 50,3% de casos en mujeres.
Graph 1. Canada: Influenza virus distribution, EW 29, 2015 –21 Graph 2. Canada: Influenza, RSV, and SARS-CoV-2 distribution
Distribución de virus de influenza, SE 29, 2015 –21 EW 29, 2015-21
Distribución de los virus influenza, VRS y SARS-CoV-2,
SE 29, 2015-21
Graph 3. Canada: Number of COVID-19 total cases in Canada as of Graph 4. Canada: Age by sex distribution of COVID-19 cases,
July 29, 2021 as of July 30, 2021
Número total de casos de COVID-19 en Canadá, Distribución de los casos de COVID-19 por edad y sexo,
al 29 de julio de 2021 al 30 de julio de 2021
Source: Coronavirus disease (COVID-19): Outbreak update. https://www.canada.ca/en/public-health
Source: Epidemiological summary of COVID-19 cases in Canada.https://www.canada.ca/en/public-health
*To view more epi data, view here. / Para ver más datos epi, vea aquí.
PAHO/OPS | INFLUENZA REGIONAL UPDATE EW 29, 2021 /ACTUALIZACIÓN REGIONAL DE INFLUENZA SE 29 DE 2021 12United States / Estados Unidos
• Up to EW 29 2021, the public health laboratory network (Graph 1) reported circulation of influenza A and B virus,
with influenza B viruses predominance. Influenza percent positive remained below the epidemic threshold while
respiratory syncytial virus activity continued increasing (Graph 2). As of EW 29, the percentage of outpatient visits
for influenza-like illness (ILI) increased compared to the previously reported, remaining below the national baseline
(2.6%) but above the average recorded in previous seasons for this time of the year (Graph 3). During EW 29, 7.4%
of the deaths were due to pneumonia, influenza, or COVID-19 (PIC) above the epidemic threshold of 5.5% for EW
29 (Graph 4). As of July 26, 2021, laboratory-confirmed COVID-19-associated hospitalizations continued to increase
(Graph 5). / Hasta la SE 29 2021, la red de laboratorios de salud pública (Gráfico 1) notificó la circulación de virus
influenza A y B, con predominio del virus influenza B. El porcentaje de positividad de influenza se mantuvo por
América del Norte
North America-
debajo del umbral epidémico, mientras que la actividad del virus respiratorio sincitial continuó en aumento
(Gráfico 2). A la SE 29, el porcentaje de consultas externas por enfermedad tipo influenza (ETI) aumentó respecto
a lo informado anteriormente, permaneciendo por debajo de la línea de base nacional (2,6%) pero por encima del
promedio registrado en temporadas anteriores para esta época del año (Gráfico 3). Durante la SE 29, el 7,4% de
las defunciones se debieron a neumonía, influenza o COVID-19 (PIC) por encima del umbral epidémico de 5,5%
para la SE 29 (Gráfico 4). Al 26 de julio de 2021, las hospitalizaciones asociadas a COVID-19 confirmadas por
laboratorio continuaron en aumento (Gráfico 5).
Graph 1. USA: Influenza virus distribution, EW 29, 2021 Graph 2. USA: Influenza and RSV distribution
2020-2021 season EW 29, 2015-21
Distribución de virus de influenza, SE 29 de 2021 Distribución de los virus influenza y VRS,
Temporada 2020-2021 SE 29, 2015-21
Content source: CDC- FluView Report
Graph 3. USA: Percentage of visits for ILI, EW 29, 2009-21 Graph 4. USA: Pneumonia, influenza, and COVID-19 mortality data
Porcentaje de visitas por ETI, SE 29, 2009-21 as of July 29, 2021
Mortalidad por neumonía, influenza y COVID-19,
datos al 29 de julio de 2021
Content source: CDC- FluView Report
Content source: CDC- FluView Report
Graph 5. USA: New hospital admissions of patients with confirmed COVID-19, August 1, 2020 - July 26, 2021
Nuevos ingresos hospitalarios de pacientes con COVID-19 confirmado, 1 de agosto de 2020 al 26 de julio de 2021
Content source: CDC - COVID Data Tracker Weekly Review
*To view more epi data, view here. / Para ver más datos epi, vea aquí.
PAHO/OPS | INFLUENZA REGIONAL UPDATE EW 29, 2021 /ACTUALIZACIÓN REGIONAL DE INFLUENZA SE 29 DE 2021 13Mexico / México
• In EW 29, 2021, no influenza detections were reported, influenza activity remained at interseasonal levels. Few
respiratory syncytial virus (RSV) detections were recorded with increased activty compared to previous weeks
(Graphs 1, 2 and 3). As of EW 29, SARS-CoV-2 percent positivity (35.6%) increased compared to the previously
registered , SARS-CoV-2 activity continued at high activity levels and increasing (Graph 2). The number of SARI
cases continued to increase and associated to elevated SARS-CoV-2 activity, remaining above the epidemic
threshold (Graph 4). / En la SE 29 de 2021, no se notificaron detecciones de influenza, la actividad de la influenza
se mantuvo en niveles interestacionales. Se registraron pocas detecciones de virus respiratorio sincitial (VRS) con
mayor actividad en comparación con las semanas anteriores (Gráficos 1, 2 y 3). A la SE 29, el porcentaje de
positividad del SARS-CoV-2 (35,6%) aumentó en comparación con el registrado anteriormente, la actividad del
América del Norte
North America-
SARS-CoV-2 continuó en niveles altos de actividad y en aumento (Gráfico 2). El número de casos de IRAG siguió
aumentando y asociado a una elevada actividad de SARS-CoV-2, manteniéndose por encima del umbral
epidémico (Gráfico 4).
Graph 1. Mexico: Influenza virus distribution, EW 29, 2015-21 Graph 2. Mexico: Influenza, RSV, and SARS-CoV-2 distribution
Distribución deL virus influenza, SE 29, 2015-21 EW 29, 2015-21
Distribución de los virus influenza, VRS y SARS-CoV-2,
SE 29, 2015-21
Graph 3. Mexico: Percent positivity for influenza, EW 29, 2021 Graph 4. Mexico: Number of SARI cases, EW 29, 2021
(compared to 2010-20) (compared to 2019-20)
Porcentaje de positividad de influenza, SE 29 de 2021 Número de casos de IRAG, SE 29 de 2021
(comparado con 2010-20) (comparado con 2019-20)
*To view more epi data, view here. / Para ver más datos epi, vea aquí.
PAHO/OPS | INFLUENZA REGIONAL UPDATE EW 29, 2021 /ACTUALIZACIÓN REGIONAL DE INFLUENZA SE 29 DE 2021 14Caribbean / Caribe
Belize / Belice
• At the national level, no influenza detections have been recorded since EW 30, 2020 (Graph 1), while increased
respiratory syncytial virus detections and activity have been reported in recent weeks (Graph 2). In EW 29, few
detections of rhinovirus among other respiratory viruses were reported. No detections of SARS-CoV-2 were reported
(Graphs 2 and 3). A nivel nacional, no se han registrado detecciones de influenza desde la SE 30 de 2020 (Gráfico 1),
mientras que en las últimas semanas se ha informado de un aumento de las detecciones y la actividad del virus
sincitial respiratorio (Gráfico 2). En la SE 29 se notificaron pocas detecciones de rinovirus entre otros virus
Caribbean-
respiratorios. No se notificaron detecciones de SARS-CoV-2 (Gráficos 2 y 3).
El Caribe
Graph 1. Belize. Influenza virus distribution EW 29, 2016-21 Graph 2. Belize: Influenza, RSV, and SARS-CoV-2 distribution,
Distribución de virus influenza SE 29, 2016-21 EW 29, 2016-21
Distribución de virus influenza, VRS y SARS-CoV-2, SE 29, 2016-21
Graph 3. Belize: RSV, SARS-CoV-2, and other respiratory viruses distribution, EW 29, 2016-21
Distribución de VRS, SARS-CoV-2 y otros virus respiratorios,
SE 29, 2016-21
*To view more epi data, view here. / Para ver más datos epi, vea aquí.
PAHO/OPS | INFLUENZA REGIONAL UPDATE EW 29, 2021 /ACTUALIZACIÓN REGIONAL DE INFLUENZA SE 29 DE 2021 15Dominica
• During the first weeks of 2020, influenza A(H1N1)pdm09 viruses circulated; since then, no influenza detections have
been reported (Graphs 1 and 2). No respiratory syncytial virus (RSV) detections have been registered (Graph 2). As
of EW 28, SARI activity was below levels observed in previous seasons for the same period (Graph 3). / Durante las
primeras semanas de 2020, circularon los influenza A(H3N2); desde entonces, no se han notificado detecciones de
influenza (Gráficos 1 y 2). No se han registrado detecciones de virus respiratorio sincitial (VRS) (Gráfico 2). A la SE
28, la actividad de IRAG estuvo por debajo de los niveles observados en temporadas anteriores para el mismo
período (Gráfico 3).
Graph 1. Dominica. Influenza virus distribution, EW 28, 2015-21 Graph 2. Dominica: Influenza and RSV distribution, EW 28, 2015-21
Distribución de virus influenza, SE 28, 2015-21. Distribución de virus influenza y VRS, SE 28, 2015-21
Caribbean-
El Caribe
Graph 3. Dominica: Number of SARI cases, EW 28, 2021 (compared to 2010-20)
Número de casos de IRAG, SE 28 de 2021 (comparado con 2010-20)
PAHO/OPS | INFLUENZA REGIONAL UPDATE EW 29, 2021 /ACTUALIZACIÓN REGIONAL DE INFLUENZA SE 29 DE 2021 16Dominican Republic / República Dominicana
• During EW 29, no influenza viruses were detected in tested samples. Respiratory syncytial virus activity remained
at baseline levels with no detections as of July 30, 2021. Influenza activity remained at baseline levels compared to
the average level of previous seasons for this time of the year (Graphs 1, 2, and 3). No SARS-CoV-2 detections were
reported with no other respiratory viruses detected (Graph 4). In EW 27, the number of SARI cases remained below
the epidemic threshold at baseline activity levels (Graph 5); the number of ILI cases remained below the seasonal
threshold (Graph 6). / Durante la SE 29, no se detectaron virus de influenza en las muestras analizadas. La actividad
del virus respiratorio sincitial se mantuvo en los niveles iniciales sin detecciones a julio 30 de 2021. La actividad de
la influenza se mantuvo en el nivel basal en comparación con el nivel promedio de temporadas anteriores para esta
época del año (Gráficos 1, 2 y 3). No se notificaron detecciones de SARS-CoV-2 sin que se detectaran otros virus
respiratorios (Gráfico 4). En la SE 27, el número de casos de IRAG se mantuvo por debajo del umbral epidémico en
los niveles de actividad basal (Gráfico 5); el número de casos de ETI se mantuvo por debajo del umbral estacional
(Gráfico 6).
Caribbean-
El Caribe
Graph 1. Dominican Republic: Influenza virus distribution, Graph 2. Dominican Republic Influenza and RSV distribution,
EW 29, 2015-21 EW 29, 2015-21
Distribución del virus influenza, SE 29, 2015-21 Distribución de los virus influenza y VRS, SE 29, 2015-21
Graph 3. Dominican Republic: Percent positivity for influenza, Graph 4. Dominican Republic: RSV, SARS-CoV-2, and other
EW 29, 2021 (compared to 2010-20) respiratory viruses distribution, EW 29, 2015-21
Porcentaje de positividad de influenza, Distribución de VRS, SARS-CoV-2 y otros virus respiratorios,
SE 29 de 2021 (comparado con 2010-20) SE 29, 2015-21
Graph 5. Dominican Republic: Number of SARI cases, EW 27, 2021 Graph 6. Dominican Republic: Number of ILI cases, EWs 1-27, 2021
(compared to 2018-20) Número de casos de ETI, SE 1-27 de 2021
Número de casos de IRAG, SE 27 de 2021
(comparado con 2018-20)
*To view more epi data, view here. / Para ver más datos epi, vea aquí.
PAHO/OPS | INFLUENZA REGIONAL UPDATE EW 29, 2021 /ACTUALIZACIÓN REGIONAL DE INFLUENZA SE 29 DE 2021 17French Territories / Territorios Franceses
• Guadeloupe: During EW 29, 1093 new COVID-19 cases have been confirmed (compared to 327 in EW 28). The
number of ARI estimated cases increased 2.8 times compared to the previous week (Graph 1). Saint-Martin: As of
EW 29, 2021, 62 (compared to 58 previously) COVID-19 new cases were confirmed; the number of ARI consultations
increased compared to the previously recorded (Graph 2). Saint-Barthelemy: In EW 29, the number of new
confirmed COVID-19 cases rose to 156 (eight cases recorded in EW 28). The number of ARI consultations increased
compared to numbers observed early in 2020 (Graph 3). Martinique: The number of new COVID-19 cases (3609)
increased compared to 2258 previously reported positive. During EW 29, the number of ARI teleconsultations
continued to increase compared to prior recordings (Graph 4). Guiana: As of July 30, 2021, 30 040 cases of COVID-
19 were confirmed, with 708 new cases during EW 29. Overall, the consultation rate (160 per 100 000 population)
for acute respiratory infections increased compared to the previously registered (Graph 5). / Guadalupe: durante la
SE 29, se confirmaron 1093 nuevos casos de COVID-19 (con respect a 327 en la SE 28). El número de casos estimados
de IRA aumentó 2,8 veces respecto a la semana anterior (Gráfico 1). San Martín: a la SE 29 de 2021, se confirmaron
62 (en comparación con 58 anteriormente) casos nuevos de COVID-19; el número de consultas por IRA aumentó
Caribbean-
respecto a lo registrado anteriormente (Gráfico 2). San Bartolomé: en la SE 29, el número de nuevos casos
El Caribe
confirmados de COVID-19 ascendió a 156 (ocho casos registrados en la SE 28). El número de consultas de IRA
aumentó en comparación con las cifras observadas a principios de 2020 (Gráfico 3). Martinica: el número de nuevos
casos de COVID-19 (3609) aumentó en comparación con los 2258 positivos reportados anteriormente. Durante la
SE 29, el número de teleconsultas ARI continuó aumentando respecto a grabaciones anteriores (Gráfico 4).
Guayana: al 30 de julio de 2021, se confirmaron 30 040 casos de COVID-19, con 708 casos nuevos durante la SE 29.
En general, la tasa de consultas (160 por 100 000 habitantes) por infecciones respiratorias agudas aumentó en
comparación con la registrada anteriormente (Gráfico 5).
Graph 1. Guadeloupe: Estimated number of clinically suggestive cases Graph 2. Saint-Martin: Estimated number of clinically suggestive
of acute respiratory infections, EWs 13, 2020 – 29, 2021* cases of acute respiratory infections, EWs 13, 2020 – 29, 2021*
Número estimado de casos clínicamente sugestivos de infecciones Número estimado de casos clínicamente sugestivos de
respiratorias agudas, SE 13 de 2020 a 29 de 2021 infecciones respiratorias agudas, SE 13 de 2020 a 29 de 2021
Graph 3. Saint-Barthelemy: Estimated number of clinically suggestive Graph 4. Martinique: Estimated number of clinically suggestive
cases of acute respiratory infections, EWs 13, 2020 - 29, 2021* cases of acute respiratory infections, EWs 13, 2020 - 29, 2021*
Número estimado de casos clínicamente sugestivos de infecciones Número estimado de casos clínicamente sugestivos de infecciones
respiratorias agudas, SE 13 de 2020 a 29 de 2021 respiratorias agudas, SE 13 de 2020 a 29 de 2021
Graph 5. French Guiana: Number and extrapolated rate of consultations for
acute respiratory infections per 100 000 population seen by general practitioners
Número y tasa extrapolada de consultas por infecciones respiratorias agudas
por cada 100 000 habitantes atendidas por médicos generales
* Point épidémio régional. Spécial COVID-19. GLP – MAF - BLM, MTQ, GUF/ Punto epidémico regional. Especial. COVID-19. Disponible aquí: GLP – MAF - BLM, MTQ, GUF. Integrates all evolutions
related to screening (antigenic tests, saliva tests, screening tests for suspected variants).
** To view more epi data, view here. / Para ver más datos epi, vea aquí.
PAHO/OPS | INFLUENZA REGIONAL UPDATE EW 29, 2021 /ACTUALIZACIÓN REGIONAL DE INFLUENZA SE 29 DE 2021 18Haiti / Haití
• During EW 29, no influenza or respiratory syncytial virus detections were recorded, and percent positivity remained
at baseline levels (Graphs 1 and 2). In EW 29, 20.1% (54/268) of samples tested positive for SARS-CoV-2, decreasing
compared to the percentage recorded previously but remained at a moderate activity level (Graph 2). Influenza
activity remained below epidemic levels for this time of year (Graph 3), and SARS-CoV-2 detections decreased to
previously registered (Graph 4). The number of severe acute respiratory infections hospitalizations has remained
below epidemic levels compared to earlier seasons for the same time (Graph 5). / Durante la SE 29 no se registraron
detecciones de influenza ni virus respiratorio sincitial y el porcentaje de positividad se mantuvo en los niveles basales
(Gráficos 1 y 2). En la SE 29, el 20,1% (54/268) de las muestras resultaron positivas para SARS-CoV-2, disminuyendo
respecto al porcentaje registrado anteriormente, pero se mantuvo en un nivel de actividad moderado (Gráfico 2). La
actividad de la influenza se mantuvo por debajo de los niveles epidémicos para esta época del año (Gráfico 3) y las
detecciones de SARS-CoV-2 disminuyeron a las registradas anteriormente (Gráfico 4). El número de hospitalizaciones
por infecciones respiratorias agudas graves se ha mantenido por debajo de los niveles epidémicos en comparación
Caribbean-
con temporadas anteriores durante el mismo tiempo (Gráfico 5).
El Caribe
Graph 1. Haiti: Influenza virus distribution EW 29, 2015-21 Graph 2. Haiti: Influenza, RSV, and SARS-CoV-2 distribution,
Distribución de virus influenza SE 29, 2015-21 EW 29, 2015-21
Distribución de los virus influenza, VRS y SARS-CoV-2,
SE 29, 2015-21
Graph 3. Haiti: Percent positivity for influenza, EW 29, 2021 Graph 4. Haiti: RSV, SARS-CoV-2, and other respiratory viruses
(compared to 2015-20) distribution, EW 29, 2019-21
Porcentaje de positividad de influenza, SE 29 de 2021 Distribución del VRS, SARS-CoV-2 y otros virus, SE 29, 2019-21
(comparado con 2015-20)
Graph 4. Haiti: Number of SARI cases, EW 27, 2021
(compared to 2017-20)
Número de casos de IRAG, SE 27 de 2021
(comparado con 2017-20)
*To view more epi data, view here. / Para ver más datos epi, vea aquí.
PAHO/OPS | INFLUENZA REGIONAL UPDATE EW 29, 2021 /ACTUALIZACIÓN REGIONAL DE INFLUENZA SE 29 DE 2021 19Jamaica
• No influenza, RSV, or other respiratory viruses (ORV) detections have been recorded this year (Graph 1). SARS-
CoV-2 percent positivity increased (1.6%) compared to the percentage recorded the previous week (Graph 2).
The percent positivity for influenza remained below the average seen in last seasons (Graph 3). SARI
hospitalizations per 100 have decreased in recent weeks and were below the seasonal threshold (Graph 4). After
EW 13, the number of pneumonia cases has remained below the epidemic threshold (Graphs 5), while the
number of ARI cases continued to hover below the seasonal threshold (Graph 6). / Este año no se han registrado
detecciones de influenza, VRS u otros virus respiratorios (OVR) (Gráfico 1). El porcentaje de positividad para
SARS-CoV-2 aumentó (1,6%) en comparación con el porcentaje registrado la semana anterior (Gráfico 2). El
porcentaje de positividad para influenza se mantuvo por debajo del promedio observado en las últimas
temporadas (Gráfico 3). Las hospitalizaciones por IRAG por 100 disminuyeron y se ubicaron por debajo del
umbral estacional (Gráfico 4). Después de la SE 13, el número de casos de neumonía se ha mantenido por debajo
del umbral epidémico (Gráficos 5), mientras que el número de casos de IRA continuó por debajo del umbral
Caribbean-
El Caribe
estacional (Gráfico 6).
Graph 1. Jamaica: Influenza virus distribution Graph 2. Jamaica: Influenza, RSV, and SARS-CoV-2 distribution,
EW 28, 2015-21 EW 28, 2015-21
Distribución de virus influenza SE 28, 2015-21 Distribución de los virus influenza, VRS y SARS-CoV-2, SE 28, 2015-21
Graph 3. Jamaica: Percent positivity for influenza, EW 28, 2021 Graph 4. Jamaica: SARI hospitalizations/100 hospitalizations,
(compared to 2010-20) EW 28, 2021 (compared to 2011-20)
Porcentaje de positividad de influenza, SE 28 de 2021 Hospitalizaciones de IRAG/100 hospitalizaciones, SE 28 de 2021
(comparado con 2010-20)2 (comparado con 2011-20)
Graph 5. Jamaica: Number of pneumonia cases, Graph 6. Jamaica: Number of ARI cases, EW 28, 2021
EW 28, 2014-21 (compared to 2011-20)
Número de casos de neumonía, SE 28, 2014-21 Número de casos de IRA, SE 28 de 2021
(comparado con 2011-20)
*To view more epi data, view here. / Para ver más datos epi, vea aquí
PAHO/OPS | INFLUENZA REGIONAL UPDATE EW 29, 2021 /ACTUALIZACIÓN REGIONAL DE INFLUENZA SE 29 DE 2021 20Saint Lucia / Santa Lucía
• As of EW 28, no influenza or respiratory syncytial virus detections have been reported (Graph 1). In EW 28, SARS-
CoV-2 percent positivity (3.3%) remained stable compared to the previously recorded while detections decreased
slightly (Graphs 2 and 3). The number of ILI cases among children less than five years decreased compared to
previously registered and was below the average observed in previous seasons. Denery reported the highest
proportion of ILI cases. Among persons aged five years and older, the number of ILI cases decreased and continued
above the seasonal threshold for this time of year (Graphs 4 and 5). During EW 28, the number of ILI cases among
persons five years and older remained stable. Soufriere recorded the highest number of cases. In EW 28, SARI cases
/ 100 hospitalizations decreased and remained below the epidemic threshold (Graph 6). / A la SE 28 no se han
notificado detecciones de influenza ni virus respiratorio sincitial (Gráfico 1). En la SE 28, el porcentaje de positividad
para SARS-CoV-2 (3,3%) se mantuvo estable en comparación con lo registrado anteriormente, mientras que las
detecciones disminuyeron levemente (Gráficos 2 y 3). El número de casos de ETI en niños menores de cinco años
disminuyó en comparación con los registrados anteriormente y estuvo por debajo del promedio observado en
Caribbean-
El Caribe
temporadas anteriores. Denery informó la mayor proporción de casos de ETI. Entre las personas de cinco años o
más, el número de casos de ETI disminuyó y continuó por encima del umbral estacional para esta época del año
(Gráficos 4 y 5). Durante la SE 28, el número de casos de ETI en personas de cinco años y más se mantuvo estable.
Soufriere registró el mayor número de casos. En la SE 28, los casos de IRAG / 100 hospitalizaciones disminuyeron y
se mantuvieron por debajo del umbral epidémico (Gráfico 6).
Graph 1. Saint Lucia: Influenza virus distribution, Graph 2. Saint Lucia: Influenza, RSV, and SARS-CoV-2 virus
EW 28, 2015-21 distribution, EW 28, 2015-21
Distribución de virus influenza, SE 28, 2015-21 Distribución de los virus influenza, VRS y SARS-CoV-2, SE 28, 2015-21
Graph 3. Saint Lucia: RSV, SARS-CoV-2, and other respiratory Graph 4. Saint Lucia: ILI case distribution among the < 5 years of age,
viruses distribution, EW 28, 2015-21 EW 28, 2021 (compared to 2016-20)
Distribución del VRS, SARS-CoV-2 y otros virus respiratorios, SE 28, Distribución de ETI entre losCentral America / América Central
Costa Rica
• As of EW 29, no influenza or respiratory syncytial virus detections have been recorded. Few rhinovirus and coronavirus
detections were reported. SARS-CoV-2 percent positive increased to 45.3% from 43.5% the previous week and
remained at high activity level (Graphs 1, 2, and 3). SARS-CoV-2 detections decreased from the number previously
reported (Graph 4). Overall, the number of severe acute respiratory infections (SARI) decreased, remaining at baseline
activity levels (Graph 5). / A la SE 29, no se registraron detecciones de influenza ni de virus respiratorio sincitial. Se
notificaron pocas detecciones de rinovirus y coronavirus. El porcentaje de positividad de SARS-CoV-2 aumentó a 45,3%
desde 43,5% la semana anterior y se mantuvo en un nivel alto de actividad (Gráficos 1, 2 y 3). Las detecciones de
SARS-CoV-2 disminuyeron con respecto al número informado anteriormente (Gráfico 4). En general, el número de
infecciones respiratorias agudas graves (IRAG) disminuyó, manteniéndose en los niveles de actividad de referencia
(Gráfico 5).
Central America-
América Central
Graph 1. Costa Rica: Influenza virus distribution, Graph 2. Costa Rica: Influenza, RSV, and SARS-CoV-2 distribution,
EW 29, 2015-21 EW 29, 2015-21
Distribución de virus influenza por SE 29, 2015-21 Distribución de los virus influenza, VRS y SARS-CoV-2, SE 29, 2015-21
Graph 3. Costa Rica: Percent positivity for influenza, EW 29, 2021 Graph 4. Costa Rica: RSV, SARS-CoV-2, and other respiratory viruses
(compared to 2011-20) distribution, EW 29, 2015-21
Porcentaje de positividad de influenza, SE 29 de 2021 Distribución del VRS, SARS-CoV-2 y otros virus respiratorios, SE 29,
(comparado con 2011-20) 2015-21
Graph 5. Costa Rica: Number of SARI cases, EW 29, 2021
(compared to 2013-20)
Número de casos de IRAG, SE 29 de 2021
(comparado con 2013-20)
*To view more epi data, view here. / Para ver más datos epi, vea aquí.
PAHO/OPS | INFLUENZA REGIONAL UPDATE EW 29, 2021 /ACTUALIZACIÓN REGIONAL DE INFLUENZA SE 29 DE 2021 22El Salvador
• In 2021, no influenza detections have been recorded, and influenza activity remained below the seasonal threshold
(Graphs 1 and 3). In EW 29, no respiratory syncytial virus (RSV) detections were reported with decreased activity.
Few detections of parainfluenza and adenovirus were recorded. Percent positivity for SARS-CoV-2 (10.7%)
increased compared to the numbers reported in the previous week with increased detections recorded (Graphs 2
and 4). / En 2021, no se registraron detecciones de influenza y la actividad de la influenza se mantuvo por debajo
del umbral estacional (Gráficos 1 y 3). En la SE 29, no se notificaron detecciones de virus respiratorio sincitial (VRS)
con actividad disminuida. Se registraron pocas detecciones de parainfluenza y de adenovirus. El porcentaje de
positividad para el SARS-CoV-2 (10,7%) aumentó con respecto a los números notificados en la semana anterior,
con aumento en el registro de detecciones (Gráficos 2 y 4).
Central America-
América Central
Graph 1. El Salvador: Influenza virus distribution, EW 29, 2015-21 Graph 2. El Salvador: Influenza, RSV, and SARS-CoV-2 distribution,
Distribución de virus influenza, SE 29, 2015-21 EW 29, 2015-21
Distribución de los virus influenza, VRS y SARS-CoV-2, SE 29, 2015-21
Graph 3. El Salvador: Percent positivity for influenza, Graph 4. El Salvador: RSV, SARS-CoV-2, and other respiratory viruses
EW 29, 2021 (compared to 2010-20) distribution, EW 29, 2015-21
Porcentaje de positividad de influenza, SE 29 de 2021 Distribución del VRS, SARS-CoV-2 y otros virus respiratorios,
(comparación 2010-20) SE 29, 2015-21
*To view more epi data, view here. / Para ver más datos epi, vea aquí.
PAHO/OPS | INFLUENZA REGIONAL UPDATE EW 29, 2021 /ACTUALIZACIÓN REGIONAL DE INFLUENZA SE 29 DE 2021 23Guatemala
• During EW 29, no influenza detections were reported in Guatemala, with percent positivity remaining below epidemic
levels. Few respiratory syncytial virus (RSV) detections (one sample) were recorded at sentinel sites in EW 29, and RSV
rose to high activity levels. Percent positivity for SARS-CoV-2 (14.1 %) remained stable and detections decreased
compared to the last week (Graphs 1, 2, 3, and 4). / Durante la SE 29, no se informaron detecciones de influenza en
Guatemala, y el porcentaje de positividad se mantuvo por debajo de los niveles epidémicos. Se registraron pocas
detecciones (una muestra) de virus respiratorio sincitial (VRS) en los sitios centinela en la SE 29 y el VRS aumentó a
niveles de actividad altos. El porcentaje de positividad para SARS-CoV-2 (14,7%) permaneció igual y las detecciones
disminuyeron en comparación con la semana pasada (Gráficos 1, 2, 3 y 4).
Graph 1. Guatemala: Influenza virus distribution, EW 29, 2015-21 Graph 2. Guatemala: Influenza, RSV, and SARS-CoV-2 distribution,
Distribución de influenza, SE 29, 2015-21 EW 29, 2015-21
Central America-
América Central
Distribución de los virus influenza, VRS y SARS-CoV-2, SE 29, 2015-21
Graph 3. Guatemala: Percentage positivity for influenza, Graph 4. Guatemala: RSV, SARS-CoV-2, and other respiratory viruses
EW 29, 2021 (compared to 2010-20) distribution, EW 29, 2015-21
Porcentaje de positividad de influenza, SE 29 de 2021 Distribución del VRS, SARS-CoV-2 y otros virus respiratorios,
(comparado con 2010-20) SE 29, 2015-21
*To view more epi data, view here. / Para ver más datos epi, vea aquí.
PAHO/OPS | INFLUENZA REGIONAL UPDATE EW 29, 2021 /ACTUALIZACIÓN REGIONAL DE INFLUENZA SE 29 DE 2021 24Honduras
• As of EW 29, no influenza or respiratory syncytial virus (RSV) detections were reported. Influenza and RSV
activity remained at baseline levels (Graphs 1, 2, and 3). In EW 29, at the national level, a total of 492 samples
were analyzed for SARS-CoV-2; 26.8% tested positive, increasing from the percentage recorded the last week.
The number of severe acute respiratory infections (SARI) cases remained below the average levels of past
seasons at baseline levels (Graph 5). Influenza-like illness activity has decreased during the last few weeks
remaining at baseline activity levels for this time of year compared to previous seasons (Graph 6). / A la SE 29,
no se notificaron detecciones de influenza o virus respiratorio sincitial (VRS). La actividad de la influenza y el
VRS se mantuvo en los niveles basales (Gráficos 1, 2 y 3). En la SE 29, a nivel nacional, se analizaron un total
de 492 muestras para SARS-CoV-2; el 26,8% resultaron positivas, un aumento con respecto al porcentaje
registrado la última semana. El número de casos de infecciones respiratorias agudas graves (IRAG) se mantuvo
por debajo de los niveles medios de temporadas anteriores, en los niveles de referencia (Gráfico 5). La
Central America-
América Central
actividad de la enfermedad tipo influenza ha disminuido durante las últimas semanas, manteniéndose en los
niveles de actividad de referencia para esta época del año en comparación con temporadas anteriores (Gráfico
6).
Graph 1. Honduras: Influenza virus distribution, Graph 2. Honduras: Influenza, RSV, and SARS-CoV-2 distribution,
EW 29, 2015-21 EW 29, 2015-21
Distribución virus de la influenza, Distribución de los virus influenza, VRS y SARS-CoV-2,
SE 29, 2015-21 SE 29, 2015-21
Graph 3. Honduras: Percent positivity for influenza, EW 29, 2021 Graph 4. Honduras: RSV, SARS-CoV-2, and other respiratory virus
(compared to 2010-20) distribution, EW 29, 2015-21
Porcentaje de positividad de influenza SE 29 de 2021 Distribución del VRS, SARS-CoV-2 y otros virus respiratorios,
(comparado con 2010-20) SE 29, 2015-21
Graph 5. Honduras: SARI cases, from sentinel surveillance, Graph 6. Honduras: ILI cases, from sentinel surveillance,
EW 29, 2021 (compared to 2010-20) EW 29, 2021 (compared to 2010-20)
Casos de IRAG de la vigilancia centinela, SE 29 de 2021 Casos de ETI de la vigilancia centinela,
(comparado con 2010-20) SE 29 de 2021 (comparado con 2010-20)
*To view more epi data, view here. / Para ver más datos epi, vea aquí.
PAHO/OPS | INFLUENZA REGIONAL UPDATE EW 29, 2021 /ACTUALIZACIÓN REGIONAL DE INFLUENZA SE 29 DE 2021 25Nicaragua
• In EW 29, no influenza detections have been reported with influenza B (lineage not determined) circulating in
previous months; percent positivity remained below the average epidemic curve. No respiratory syncytial virus
(RSV) detections were recorded. RSV remained at baseline activity levels (Graphs 1, 2, and 3) with the circulation
of parainfluenza virus. SARS-CoV-2 detections and percent positivity have trended upwards (Graph 4). In EW 29,
18.8% (341/1816) of the analyzed samples tested positive for SARS-CoV-2, remaining at high activity levels. / En la
SE 29, no se informaron detecciones de influenza con la circulación del virus influenza B (linaje no determinado)
en meses anteriores; el porcentaje de positividad se mantuvo por debajo de la curva epidémica promedio. No se
registraron detecciones de virus respiratorio sincitial (VRS). El VRS se mantuvo en los niveles de actividad basales
Central America-
América Central
(Gráficos 1, 2 y 3) con la circulación del virus parainfluenza. Las detecciones de SARS-CoV-2 y el porcentaje de
positividad han mostrado una tendencia al alza (Gráfico 4). En la SE 29, el 18,8% (341/1816) de las muestras
analizadas resultaron positivas para SARS-CoV-2, manteniéndose en niveles de actividad elevados.
Graph 1. Nicaragua: Influenza virus distribution, EW 29, 2015-21 Graph 2. Nicaragua: Influenza, RSV, and SARS-CoV-2 distribution,
Distribución de influenza, SE 29, 2015-21 EW 29, 2015-21
Distribución de los virus influenza, VRS y SARS-CoV-2, SE 29, 2015-21
Graph 3. Nicaragua: Percent positivity for influenza, from sentinel Graph 4. Nicaragua: RSV and other respiratory virus distribution,
surveillance; EW 29, 2021 (compared to 2010-20) EW 29, 2015-21
Porcentaje de positividad de influenza de la vigilancia centinela; Distribución del VRS y otros virus respiratorios, SE 29, 2015-21
SE 29 de 2021 (comparado con 2010-20)
*To view more epi data, view here. / Para ver más datos epi, vea aquí.
PAHO/OPS | INFLUENZA REGIONAL UPDATE EW 29, 2021 /ACTUALIZACIÓN REGIONAL DE INFLUENZA SE 29 DE 2021 26South America / América del Sur – Andean countries / Países andinos
Bolivia
• In Bolivia, during EW 29, no influenza detections were reported at the national level, and the positive percentage
remained at baseline levels (Graph 1). One respiratory syncytial virus was recorded, with low activity levels. SARS-
CoV-2 activity and positivity decreased compared to previously registered with 13.9% positive samples
(7,914/56,866) (Graphs 2, 3, and 4). In EW 28, the number of SARI cases continued at moderate activity levels
compared to the average observed in past seasons (Graph 5). / En Bolivia, durante la SE 29, no se informaron
detecciones de influenza a nivel nacional y el porcentaje de positivos se mantuvo en los niveles basales (Gráfico 1).
Se registró una muestra de virus respiratorio sincitial, con niveles de actividad bajos. La actividad y la positividad del
SARS-CoV-2 disminuyeron en comparación con las registradas anteriormente con un 13,9% de muestras positivas
South America/ América del
Sur- Andean Countries/
(7.914/58.866) (Gráficos 2, 3 y 4). En la SE 29, el número de casos de IRAG continuó en niveles de actividad
Países Andinos
moderados en comparación con el promedio observado en temporadas pasadas (Gráfico 5).
Graph 1. Bolivia: Influenza virus distribution, EW 29, 2015-21 Graph 2. Bolivia: Influenza, RSV, and SARS-CoV-2 distribution,
Distribución de influenza, SE 29, 2015-21 EW 29, 2015-21
Distribución de los virus influenza, VRS y SARS-CoV-2, SE 29, 2015-21
Graph 3. Bolivia: Percent positivity for influenza, Graph 4. Bolivia: RSV, SARS-CoV-2, and other respiratory viruses
EW 26, 2021 (compared to 2010-20) distribution, EW 29, 2015-21
Porcentaje de positividad de influenza, SE 26 de 2021 Distribución del VRS, SARS-CoV-2 y otros virus respiratorios,
(comparado con 2010-20) SE 29, 2015-21
Graph 5. Bolivia: Number of SARI cases / 100 inpatients,
EW 29, 2021 (compared to 2015-20)
Número de casos de IRAG / 100 hospitalizaciones,
SE 29 de 2021 (comparado con 2015-20)
*To view more epi data, view here. / Para ver más datos epi, vea aquí.
PAHO/OPS | INFLUENZA REGIONAL UPDATE EW 29, 2021 /ACTUALIZACIÓN REGIONAL DE INFLUENZA SE 29 DE 2021 27También puede leer