PRICE'S INDEX THROUGH OF WEB SCRAPING - ÍNDICE DE PRECIOS A TRAVÉS DE WEB SCRAPING - VTTE UTEM
←
→
Transcripción del contenido de la página
Si su navegador no muestra la página correctamente, lea el contenido de la página a continuación
PRICE’S INDEX THROUGH OF WEB SCRAPING
ÍNDICE DE PRECIOS A TRAVÉS DE WEB SCRAPING

Paulina Pegueroles*
Rubén Guerrero**
Amaru Fernández***
Diana López****

RESUMEN: en el segundo trimestre de 2019 debido al bajo número de
 transacciones y al estancamiento del sector de la construc-
Propósito: este estudio presenta la elaboración de un Ín- ción, mostrando resultados similares a los proporcionados
dice de Precios Inmobiliarios para la Región Metropolitana por el Banco Central de Chile.
en el período que comprende desde enero de 2017 al 14
de agosto de 2019. El índice, que mide el dinamismo del Originalidad / Valor: el uso del web scraping como he-
sector, se construyó procesando 750.000 observaciones rramienta para obtener los datos en tiempo real, lo que
obtenidas desde el sitio web TocToc.com. Este sitio es permite analizar los precios de los bienes inmuebles en
una fuente secundaria de información que proporciona este momento, es una ventaja, ya que otros índices tienen
variables deterministas para construir una base de datos un retraso de seis meses o más.
formal, confiable y representativa.
 PALABRAS CLAVES: índice de precios, web scraping, cons-
Diseño / Metodología / Enfoque: para generar el Índice de trucción, Modelo Hedónico, Características Heterogéneas,
Precios Inmobiliarios en la Región Metropolitana, adoptamos Índice de Laspeyres
una metodología basada en el índice sintético, en particular
el Modelo de Precios Hedónicos (HPM), que se explica en
términos de características (heterogéneas).

El desafío será agregar más observaciones a la muestra
recopilada del sitio web TocToc y otros relacionados.

Hallazgos: la metodología de Laspeyres mostró los mejores
resultados, pero una volatilidad marginal en comparación
con las otras técnicas. Además, los resultados presentaron
una tendencia a la baja en los precios finales de los hogares

*Universidad Tecnológica Metropolitana, UTEM. Santiago, Chile. Paulina.peguerolese@utem.cl
** Universidad Tecnológica Metropolitana, UTEM. Santiago, Chile. Ruben.guerrerov@utem.cl
*** Universidad Tecnológica Metropolitana, UTEM. Santiago, Chile. Amarud@gmail.com
**** Universidad Tecnológica Metropolitana, UTEM. Santiago, Chile. Diana.lopez@utem.com

32 REVISTA CHILENA DE ECONOMÍA Y SOCIEDAD, JULIO 2021
ABSTRACT: of the construction sector, showing similar results to the
 ones provided by Central Bank of Chile.
Purpose: This study presents a design for a Real Estate Price
Index for Región Metropolitana in the period January 2017 Originality/ Value: The use of web scraping as a tool to obtain
to August 14 2019. The Index measures the dynamism of the data in real time, allowing to analyze Real State prices
the sector and it was built by processing 750,000 observa- at the moment, is an advantage, because other indexes
tions obtained from the website TocToc.com. This site is a have a six month or more time of delay.
secondary source of information providing deterministic
variables to build a formal, reliable and representative KEY WORDS: Real Estate Price Index, Web scraping, Cons-
database. truction, Hedonic Model, characteristics heterogeneous,
 Laspeyres Index.
Design/ Methodology/ Approach: In order to generate the
Real Estate Price Index in Región Metropolitana, we adopted Article Type: Research paper
a methodology based on synthetic index, particularly the
Hedonic Price Model (HPM), what is explained in terms of
characteristics (heterogeneous). JEL Code: E31
The challenge will be to add more observations to the sam-
 Fecha de recepción: 20 de marzo de 2021
ple collected from the website TocToc and others related.
 Fecha de aceptación: 27 de abril de 2021

Findings: The Laspeyres methodology showed the highest
results, but marginal volatility compared to the other tech-
niques. In addition, the results presented a declining trend
on household final prices in the second quarter of 2019 due
to both the low number of transactions, and the stagnation

 REVISTA CHILENA DE ECONOMÍA Y SOCIEDAD, JULIO 2021 33
Paulina Pegueroles ~ Rubén Guerrero
Amaru Fernández ~ Diana López

INTRODUCTION AND The development of an index depends on applying
 different methodologies to decrease the bias, as Idrovo
RESEARCH PROBLEM
 & Lennon (2011) state:
This study presents a design for a Real Estate Price
 Estos sesgos sólo podrían eliminarse si se com-
Index for Región Metropolitana in the period January
 paran en cada período los precios de mercado
2017 to August 14 2019. The Index measures the dy-
 de exactamente los mismos inmuebles, lo cual
namism of the sector and it was built by processing
 es empíricamente imposible, por lo que surge la
750,000 number of observations obtained from the
 necesidad de utilizar métodos econométricos que
website Toc Toc.com. This site is a secondary source
 permitan construir en forma teórica lo que no puede
of information providing deterministic variables to
 sostenerse en la práctica (2011, p. 4).
build a formal, reliable and representative database.
 The problem stands, therefore, on how to analyse
The Real Estate market is key for the growth of some
 housing price variations considering the dwellings’
countries1 due to its role in the gross generation of
 attributes and minimizing the bias in the data, as found
fixed capital, consumption, and the financial system.
 in previous research carried out by Banco Central de
Any variation in housing prices impacts the nations’
 Chile (BCCh) and Cámara Chilena de la Construcción
added demand and its financial stability, as Idrovo &
 (CChC).
Lennon state:

 En Chile y en la mayoría de los países desarrollados
 la inversión inmobiliaria cumple un rol fundamental OBJECTIVES
 en la actividad agregada. Tal es así que en la compo-
 sición de Cuentas Nacionales del Banco Central se The main objective of the research is to prove that a
 considera a la vivienda como un componente de la secondary source of information can be used to repre-
 Formación Bruta de Capital Fijo, equivalente al 29% sent the situation in the sector timely and effectively2
 del valor corriente de la inversión en construcción similarly to a primary one. It also aims at showing that
 (esto es un tercio de su valor real) y a 2,4% del PIB features such as price, square meters and the location
 agregado (2011, p. 3). of the dwelling, are not the main deterministic variables
 for designing a real estate housing index.
Central Bank of Chile (2014) have developed a real
estate price index, showing biased estimates because The information provided by this real estate index
of the diversity of property, posing a need for a set of could potentially be used by any agent in the economy,
uniform objects to remove or minimize this bias. On either for decision-making in the sector, investors or
the other hand, dwellings are characterized by the by individuals buying property. For the time being, the
diversity of their characteristics, making them unique data will be available for generating timely statistics of
and incomparable goods. This aspect presents the housing price dynamism, so that the strength of the
main difficulty to elaborate a real estate price index. index can be confirmed through time.

1. An example is the 2007-2009 Sub-Prime Crisis in the US where Banks
offered mortgages aiming at the geographic diversification of their
investments, adding a greater spreading the risk of their portfolio. This
fact generated a real estate bubble directly affecting the sector and other 2. It is a source of information that can explain the dynamism of the real
agents of economy. estate sector with real, timely and current data.

34 REVISTA CHILENA DE ECONOMÍA Y SOCIEDAD, JULIO 2021
PRICE'S INDEX TROUGH OF WEB SCRAPING

THEORETICAL FRAMEWORK has a positive impact generating employment in the
 construction sector, which was close to 10% of the
The housing market, the real estate and the cons- total workforce in 2017, and it is a contribution to the
truction sector shape a market as a whole. However, nominal GDP, reaching 14% in this period (Ortúzar, 2018).
there are some subtle differences among them. The
construction industry produces dwellings of varying
nature with different degrees of intervention. Housing, METHODOLOGY
in turn, is judged to be a free market, self-regulated
by suppliers and demanders in the sector. Quite the In order to generate the real estate price index in
opposite, public works are embedded in non-residential Región Metropolitana, we adopted a methodology
areas and are entirely intervened. based on synthetic index, particularly the Hedonic
 Price Model (HPM), due to the fact that the repeat
In this line, Obaíd (2003) presents typical characte- purchase rate must be applied when there are price
ristics of buildings, particularly new and old, in the changes in dwellings sold more than once (Banco
real estate sector: central, 20014, p.22). In addition, this method involves
 only old homes (Idrovo & Lennon, 2011), unlike the
 […] una de ellas y es evidente es el caso de las HPM model, where the price is explained in terms of
 transacciones, a diferencia de otros mercados las characteristics (heterogeneous for each dwelling);
 transacciones son mucho menores, también los i.e., the effect of every characteristic on the dwelling
 activos sólo pueden valorarse por referencias y price is estimated by means of multivariate analysis
 se caracteriza por una baja capacidad de generar (GLS3). Additionally, it does not distinguish between
 liquidez a corto plazo, esto por ser activos fijos y su new and old homes.
 capacidad de realización es lenta y difícil. Lo cual se
 debe a todo el trámite legal que se debe seguir y a This method can present disadvantages since it could
 los elevados precios de las operaciones, inclusos las generate biased estimates for two reasons: first, it
 más pequeñas, si se comparan con otros mercados avoids relevant variables directly affecting the dwelling
 (Salazar & Díaz, 2014, p. 17). price; second, there is an inadequate relation between
 specific characteristics of dwellings and its effects on
 the final price. Finally, it considers that dwelling pecu-
In Chile, as well as other countries, dwellings are an
 liarities are invariable through time, which is mistaken.
essential component of family wealth, and the main
loan guarantee in the financial system. For this reason,
 The analysis is carried out through three models taking
the variation of housing prices is directly related to
 into account the following variables in their generation:
the household consumption, affecting the financial
situation of the country and the financing entities
 • UF (Unidad de Fomento) value
(Parrado, Cox & Fuenzalida, 2009).
 • Useful square metres (m2)
As a result, the stability of the financial system is
 • Bathrooms
fundamental because it offers a high capacity to grant
 • Bedrooms
loans to real estate companies and partnerships. This
 • Operation type (house/apartment; new/old)
fact was evident in 2007, when the construction sector
 • District groups in Region Metropolitana (RM)
represented 9% placement of the whole banking system.
 • Advertisement date (month and year)
The real estate market is, therefore, relevant for the
economic stability of the country, both in its role for
household balance and for the financial system. It 3. Generalysed Least Square.

 REVISTA CHILENA DE ECONOMÍA Y SOCIEDAD, JULIO 2021 35
Paulina Pegueroles ~ Rubén Guerrero
Amaru Fernández ~ Diana López

Additionally, the following interactive variables were
considered:

 1) Area interactive variable: the multiplication of
 district group and useful square metres

 Arean=groupn*m2u

 2)Where Arean is the result of the multiplication of
 district groups of Región Metropolitana (groupn)
 and the useful square metres (m2u).

 3) Type of dwelling interactive variable: the
 multiplication of the dummy variable house or
 apartment and m2

 = 2 ∗ house/apartment

 C is the result of the multiplication of the dummy
 variable house or apartment (house/apartment)
 and the useful square metres (m2).

The models are expressed as follows:

Equation 1: Multivariate Regression: (r1):

Where the dwelling price (Pi) is explained by means of
their different characteristics.

Equation 2: Multivariate Regression: (r2):

The second model or semi-log (r2) transforms the
dependent variable into a logarithm.

36 REVISTA CHILENA DE ECONOMÍA Y SOCIEDAD, JULIO 2021
PRICE'S INDEX TROUGH OF WEB SCRAPING

Equation 3: Multivariate Regression: (r3):

The third and last model log-log (r3) expresses the price two index, finding the square root in its product
and the useful square metres in a logarithm. (Webster A., 2000).
 In addition, the models have in common the same
The Akaike Information Criterion (AIC) was used to select parameters and corresponding to the slope and
one of the three models, showing that the log-log (r3) intercept, respectively.
explains data with the minimum number or parameters,
in comparison to the linear model, which takes into Equation 4: Price Index
account the non-linearity between the square metres
and the dwelling price, as shown in Table 1.

The coefficients and standard deviations for every
explanatory model variable can be observed in Table
2. In tables 3 and 4, it is possible to observe the single
coefficients for both apartment and house index.

After the selection of the model, the price index was
formulated based on three kinds of methodology:
Laspeyres, Paasche and Fisher
 Source: Cámara Chilena de la Construcción, 2011.
• The Laspeyres Index4 ) refers to an arithmetic
 mean of simple price index, used as estimation
 for the value of transactions carried out in a base
 period; i.e., in every period t (Curiel Díaz, J., 1997). RESULTS

• The Paasche Index5 ( takes into account the pur- The observations used for the Real Estate Index of
 chase patterns of regular buyers, showing the the RM data were reduced from a total of 750,000 to
 taste and needs of consumers within the index 85,798, because the following dwellings were removed:
 (Webster A., 2000). all dwellings for rent, all those outside RM, and those
 that had no data in relation to region, district, useful
• The Fisher Index is the ideal price index because it square metres, bedrooms, bathrooms, UF value, and
 reduces the shortcomings resulting from the other those observations generating data outliers.16% of
 total data were imputed because they had data in the
 other variables and they lacked one characteristic. Table
 N°5 shows the percentage of the imputed variables.
4. The advantage of this index is that it requires data for only one period
because its only varying element in time is price. However, it is disadvan- The UF value is the dependent variable of the study. It
tageous in that it overestimates the increasing good prices, keeping the
amount constant. was modified according to the value stated by Banco
5. The weakness of this index is to underestimate increasing good prices. Central de Chile at the time the dwelling was adver-

 REVISTA CHILENA DE ECONOMÍA Y SOCIEDAD, JULIO 2021 37
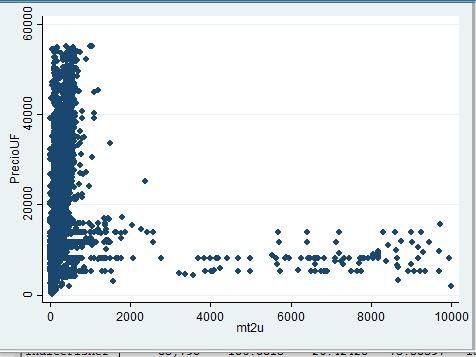
Paulina Pegueroles ~ Rubén Guerrero
Amaru Fernández ~ Diana López

tised. Then, all missing values was imputed6, under With the district groups it is possible to observe the
150 UF and over 55,000 UF. Another variable used relation between square metres and the UF value. See
to establish maximum and minimum margins is the the Dispersion graph 1.
useful square metres, with a minimum of 21 m2 and a
maximum of 10,000 m2. These margins were selected This graph displays that the data of group 1 lean towards
because some square metres in dwellings and the the left, showing an important number of small hou-
area they were located that in were not regulated, seholds at a high price. These high prices are due to
either because of mistyping or a wrong report on the their location, which increases the surplus value (not
dwellings’ characteristics. to be analysed in this article). In the first quarter of
 2019, one-bedroom one-bathroom apartments have
After the imputation, we can see that out of the 85,798 increased sale prices by 7.8% in comparison to the
observations, 49% are houses and 51% apartments. first quarter 2018. On the other hand, three-bedroom
1% correspond to new housing and 99% to old ones. one-bathroom houses increased their prices by 10.3%
This shows that they are mostly old apartments. whereas three-bedroom two-bathroom houses in-
 creased by 5.5%7.
To make a difference between new and old real estate,
we created a dummy where 1 is new and 0 is old. The The household price in UF varies mainly according to
same was done with houses being 1 and apartments its square metres, rather than the number of rooms.
being 0. The most frequently advertised houses have 3 or 4
 bedrooms (70%) and the most frequently advertised
Regarding the number of observations, 2019 is the apartments have 2 or 3 bedrooms (35% and 43%,
year with the highest number of advertised real es- respectively).
tate with a total of 43,759, which represents a 25%
increase compared to 2018. In 2018 the number of Table 8 shows the descriptive statistics for every expla-
advertisements had an increase 4 times higher than natory variable in the period January 2017 - August 2019.
the previous year, probably due to the tendencies of
e-commerce in Chile. According to Centro de Economía Two interactive variables are added. First, the area
Digital CCS (2019) financial and real estate services interactive variable (the multiplication of district
had an increase of 146% in the digital market in 2018. groups and m2). Second, the type of dwelling interac-
57 districts comprise the database. They are classified tive variable (the multiplication of the dummy variable
into seven groups according to their frequency rate house/apartment and m2).
and their geographical location. Table N°7 shows these
frequencies. In order to create the index, we generated a linear model
 expressed in terms of logarithms that do not take into
From the above table, we can see that group 1 has the account the non-linearity between the square metres
highest number of advertisements with real estate for and the price. After calculating the monthly prices, we
sale with 30,839. Las Condes is the district with the used the December 2018 period estimates, as stated in
highest number of observations with a total of 13,576, the Laspeyres Index methodology. This was applied as
followed by Santiago with 9,206 data in group 4. a whole including both houses and apartments and,
 on the other hand, separating houses and apartments
 so as to reach a more accurate result for each of them.

6. The imputation method applied to all the variables of the study is the
imputation of conditional mean for a set of data. 7. According to Informe Trimestral de Viviendas de Portal Inmobiliario.

38 REVISTA CHILENA DE ECONOMÍA Y SOCIEDAD, JULIO 2021
PRICE'S INDEX TROUGH OF WEB SCRAPING

Graph 2 shows the volatile performance of prices in the it is possible to build a tertiary source of information
index as a whole, including houses and apartments. or non-traditional mechanism to collect information
This also happens in relation to the square metres, by contrasting sources. This article compares the stu-
which, according to the primary source Banco Central dies carried out by Banco central de Chile and Cámara
de Chile, closed on the decline by July 2019. Chilena de la Construcción, deploying the reality of
 the real estate sector and explaining its dynamism
By the second quarter of 2019 we observe that this through ongoing and prompt data.
trend on the decline is only related to the performance
of apartment prices (see Graph 4) rather than houses
(see Graph 5). This fact shows that apartments are the Within the three methodologies, Laspeyres showed the
most important household for sale in the real estate highest, but marginal volatility. In addition, it presented
market. a trend on the decline on household final prices in the
The variations in the performance in household prices second quarter 2019 due to both the low number of
with this index is similar to the previous one, for both transactions and the stagnation of the construction
houses and apartments. However, the structures of the sector, showing similar results to the ones provided
two index are different. The Laspeyres methodology by Banco Central de Chile.
use the base period, December 2018, and the square
metre average is maintained for estimations. The For better results, the following changes could be
Paasche methodology, the coefficient of regression made in the study:
of the base period is kept, but the square metre of
each period is used. • Add data to the sample collected from the website
 TocToc from other similar databases; for example,
We highlight that the apartment prices (Graph 7) have Portal Inmobiliario, el Rastro and Yapo. This would
a slow-paced performance in comparison to previous result in an index with a wider time span to observe
index, since May 2018. more slow-paced and accurate variations in prices.
 Additionally, a quarterly period index could be
Due to the fact that this index corresponds to the elaborated to compare the results with the index
square root of the interaction between the previous coming from primary sources in the same period.
two indicators, the Fisher methodology aims at di-
minishing the undervaluation and the overvaluation • Spread the index to other regions in Chile. Also,
generated by the Laspeyres and Paasche ones in the include other variables to the hedonic model of
different periods. Therefore, it is an intermediate result TocToc website; for instance, the amount of fa-
between both. However, as fluctuations are similar, vourites, visits, interested people, appraised value
the Fisher index does not have significant restraints, and payment delinquency.
confirming the results previously mentioned.
 • Expand the analysis using rent data to generate an
 index that showed the characteristics increasing or
 decreasing the household rent price. This is based
CONCLUSIONS AND
 on the fact that the Ministerio de Desarrollo Social
RECOMMENDATIONS (2017) states that the amount of people renting
 household is on the rise.
The database collected by web scraping meet the quality
requirements stated by Wang & Strong (2013), e.g.,
credibility, objectivity and relevance. This reflects that

 REVISTA CHILENA DE ECONOMÍA Y SOCIEDAD, JULIO 2021 39
Paulina Pegueroles ~ Rubén Guerrero
Amaru Fernández ~ Diana López

LIST OF REFERENCES tiago. Bachelor thesis in Business Administration, Univer-
 sidad del Bio-Bio, Chillán, Chile. Retrieved from: http://
Banco Central de Chile (2014). Índice de Precios de repobib.ubiobio.cl/jspui/bitstream/123456789/346/1/
Vivienda en Chile: Metodología y Resultados. Retrieved Salazar%20Guti%C3%A9rrez%2C%20Mauricio%20
from: https://si2.bcentral.cl/public/pdf/estudios-eco- Andr%C3%A9s.pdf
nomicos-estadisticos/pdf/see107.pdf
 Webster, A. (2000). Estadística aplicada a los negocios y
Curiel Díaz J. (1997). La teoría de los índices de precios. la economía (3rd ed.). Bogotá, Colombia: McGraw-Hill.
Cuadernos de Estudios Empresariales, (7), 71-88. Madrid,
España. Escuela Universitaria de Estudios Empresariales.
Universidad Complutense. ISSN: 1131-6985

Centro Economía Digital CCS (2019). Tendencia del
Comercio electrónico en Chile. Retrieved from: https://
www.ecommerceccs.cl/wp-content/uploads/2019/04/
Tendencias-Ecommerce-2019_George-Lever_eCom-
merce-Day-2019.pdf

Idrovo, B. y Lennon, J. (2011). Hedonic pricing models to
calculate price indexes for new houses in the Santiago
province. Munich Personal RePEc Archive. Retrieved
from: https://mpra.ub.uni-muenchen.de/31400/1/
MPRA_paper_31400.pdf

Ministerio de Desarrollo Social (2017). Resultados
Vivienda y entorno. Retrieved from: http://www.desa-
rrollosocialyfamilia.gob.cl/storage/docs/DOCUMEN-
TO_VIVIENDA_Y_ENTORNO_RMS_CASEN_2017.pdf

Ortúzar, R. (2018). Inversiones + Planificación = De-
sarrollo Sustentable. [Diapositivas de PowerPoint,1-12,
impreso]

Parrado, E.; Cox, P. y Fuenzalida, M. (2009). Evolución
de los Precios de Viviendas en Chile. ResearchGate,
12(1). Retrieved from: https://www.researchgate.
net/profile/Eric_Parrado/publication/28321749_Evo-
lucion_de_los_Precios_de_Viviendas_en_Chile/
links/53fe76620cf283c3583bd80b/Evolucion-de-los-
Precios-de-Viviendas-en-Chile.pdf

Salazar, M. y Díaz, M. (2014). Influencia del Desarrollo
Urbano en el Mercado Inmobiliario de la ciudad de San-

40 REVISTA CHILENA DE ECONOMÍA Y SOCIEDAD, JULIO 2021
PRICE'S INDEX TROUGH OF WEB SCRAPING

TABLES AND GRAPHICS

Table 1: Results AIC for the three econometric models

 Model Obs. II Nul II Model DF AIC
 R1 85,798 -884460 -857098.2 19 1714234
 R2 85,798 -105002.8 -58599.02 19 117236
 R3 85,798 -105002.8 -54762.82 19 109563.6
Source: authors’ compilation.

Hint: The table show the results of AIC for three mo-
dels, where the model R3 is choosed beacuse it has
the least AIC.

Table2: Coefficients and explanatory variables

 Lnpf Coef. Std. Err.
 Lmt2u .3712375*** .0080446
 Bathrooms .1994831*** .003023
 Bedrooms .0241997*** .0026261
 New/old .0581066*** .0135575
 House/apartment .1236726*** .0056413
 group1 .7945399*** .0071347
 group2 .4214615*** .0065206
 group3 -.20647143*** .0082785
 group5 -.11855838*** .0082767
 group6 -.0022412 .0087934
 group7 .31559121*** .0107332
 area1 -.00021717*** 7.82e-06
 area2 -.00026471*** .0000122
 area3 -.00026827*** .0000282
 area5 -.00031762*** .0000234
 area6 -.00026573*** .0000246
 area7 -.00015332*** .0000257
 C -.0000115 .0000202
 _cons 6.026263*** .0273144
 Legend: * p
Paulina Pegueroles ~ Rubén Guerrero
Amaru Fernández ~ Diana López

Hint: The table shows the coefficients and stander
deviations of real estate index, where the variables
lmt2u, group1 and group2 are of the biggest contri-
bution to the model.

Table 3: Coefficients of explanatory variables (Houses)

 Lnpf Coef. Std. Err.
 Lmt2u .499*** .010792
 bathrooms .163*** .0035781
 bedrooms .0139*** .0035661
 New/old -.0417 .0383982
 group1 .795*** .0305768
 group2 .458*** .0286836
 group3 -.246*** .0279983
 group5 -.14*** .0283097
 group6 -.0575** .0292065
 group7 .276*** .0288905
 area1 -6.6e-05 .0001631
 area2 8.4e-05 .0001539
 area3 4.0e-05 .0001516
 area5 .00013** .0001504
 area6 .00015** .000151
 area7 .00019*** .0001497
 C -.00045*** .0001499
 _cons 5.7*** .0513915
 Legend: * p
PRICE'S INDEX TROUGH OF WEB SCRAPING

Table 4: Coefficients of explanatory variables (Apart-
ments)

 Lnpf Coef. Std. Err.
 Lmt2u .268*** .01054
 Bathrooms .273*** .0049295
 bedrooms .0189*** .0036128
 New/old .0747*** .0113992
 group1 .804*** .0082358
 group2 .368*** .0068867
 group3 -.0509*** .0120961
 group5 -.0847*** .0106857
 group6 .0534*** .0100618
 group7 .176*** .0815187
 area1 -.00014*** 8.10e-06
 area2 -.00019*** .0000131
 area3 -.00018*** .0000358
 area5 -.00032*** .0000159
 area6 -.00022*** .0000285
 area7 .00015 .00002133
 _cons 6.33*** .0350595
 Legend: * p
Paulina Pegueroles ~ Rubén Guerrero
Amaru Fernández ~ Diana López

Hint: The table shows the imputation percentage of the
variables in study, where the UF value has the highest
imputation percentage with 34%.

Table N°6: Real estate advertising from 2017 to 2019

 Año Total de Publicaciones
 2017 7.099
 2018 34.940
 2019 43.759

Source: authors’ compilation.

Hint: The table shows the number of observations for
each year, where the year with the most properties
for sale was 2019.

Table N°7: District groups in RM 2017- 2019

Source: authors’ compilation.

44 REVISTA CHILENA DE ECONOMÍA Y SOCIEDAD, JULIO 2021
PRICE'S INDEX TROUGH OF WEB SCRAPING

Hint: The table shows the 7 groups with their respec-
tive districts, where group 1 has the highest number
observations, 30,839, continued from group 2 with
13,812. Further, the district of Las Condes, along with
Santiago, are the most widely published.

Graph N°1: M² according to UF price in group 1

Source: authors’ compilation.

Hint: The graph shows the behavior of the Price based
on mt2u, where the sample is concentrated in proper-
ties less than 2,000.

 REVISTA CHILENA DE ECONOMÍA Y SOCIEDAD, JULIO 2021 45
Paulina Pegueroles ~ Rubén Guerrero
Amaru Fernández ~ Diana López

Table 8: Variables of the real estate index January 2017
- August 2019

Source: authors’ compilation.

Hint: The table shows a statistical summary about the
relevant variables for the real estate index, differentiated
by groups, for apartments and houses. The highest
average prices UF correspond to group 1.

Graph 2: Real estate index of RM 2017-August 2019

Source: authors’ compilation.

46 REVISTA CHILENA DE ECONOMÍA Y SOCIEDAD, JULIO 2021
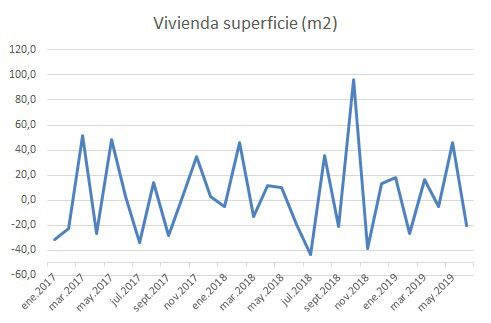
PRICE'S INDEX TROUGH OF WEB SCRAPING

Hint: The graph shows the behavior of the generalized
price index through the Laspeyres methodology. It
stands out, a drop in the price level in August 2019

Graph 3: Household m²

Source: Banco Central de Chile, 2019.

Hint: The graph presents the variation of the surface
of the houses over time.

 REVISTA CHILENA DE ECONOMÍA Y SOCIEDAD, JULIO 2021 47
Paulina Pegueroles ~ Rubén Guerrero
Amaru Fernández ~ Diana López

Graph 4: Real estate index of RM, between 2017 and
August 2019 with Laspeyres methodology (apartments).

Source: authors’ compilation.

Hint: The graph shows the behavior of the price
index for apartments using the Laspeyres me-
thodology, highlighting a drop in the price level
in August 2019.

48 REVISTA CHILENA DE ECONOMÍA Y SOCIEDAD, JULIO 2021
PRICE'S INDEX TROUGH OF WEB SCRAPING

Graph 5: Real estate index of RM, between 2017 and
August 2019 with Laspeyres methodology (houses).

Source: authors’ compilation.

Hint: The graph shows the behavior of the price index
for houses through the Laspeyres methodology, reflec-
ting a rise in the price level in August 2019.

 REVISTA CHILENA DE ECONOMÍA Y SOCIEDAD, JULIO 2021 49
Paulina Pegueroles ~ Rubén Guerrero
Amaru Fernández ~ Diana López

Graph 6: Real estate index of RM, between 2017 and
August 2019 with Paasche methodology.

Source: authors’ compilation.

Hint: The graph shows the behavior of the price index
generalized through the Paasche methodology; it
shows similar results to the previous ones.

Graph 7: Real estate index of RM, between 2017 and
August 2019 with Paasche methodology (apartments

Source: authors’ compilation.

50 REVISTA CHILENA DE ECONOMÍA Y SOCIEDAD, JULIO 2021
PRICE'S INDEX TROUGH OF WEB SCRAPING

Hint: The graph shows the behavior of the price index
for apartments through the Paasche methodology.

Graph 8: Real estate index of RM, between 2017 and
August 2019 with Paasche methodology (houses).

Source: authors’ compilation.

Hint: The graph shows the behavior of the price index
for houses through the Paasche methodology.

 REVISTA CHILENA DE ECONOMÍA Y SOCIEDAD, JULIO 2021 51
Paulina Pegueroles ~ Rubén Guerrero
Amaru Fernández ~ Diana López

Graph 9: Real estate index of RM, between 2017 and
August 2019 with Fisher methodology.

Source: authors’ compilation.

Hint: The graph shows the behavior of the price index
generalized through the Fisher methodology; agreeing
with the results of the previous methodologies.

52 REVISTA CHILENA DE ECONOMÍA Y SOCIEDAD, JULIO 2021
PRICE'S INDEX TROUGH OF WEB SCRAPING

Graph 10: Real estate index of RM, between 2017 and
August 2019 with Fisher methodology (apartments).

Source: authors’ compilation.

Hint: The graph shows the behavior of the price index
for apartments through the Fisher methodology.

 REVISTA CHILENA DE ECONOMÍA Y SOCIEDAD, JULIO 2021 53
Paulina Pegueroles ~ Rubén Guerrero
Amaru Fernández ~ Diana López

Graph 11: Real estate index of RM, between 2017 and
August 2019 with Fisher methodology (houses).

Source: authors’ compilation.

Hint: The graph shows the behavior of the price index
for houses through the Fisher methodology.

54 REVISTA CHILENA DE ECONOMÍA Y SOCIEDAD, JULIO 2021
También puede leer