ALBERTO A. ALEMÁN DIRECTOR - PROINVEX - EL CLIMA DE NEGOCIOS EN PANAMÁ - AMCHAM PANAMÁ
←
→
Transcripción del contenido de la página
Si su navegador no muestra la página correctamente, lea el contenido de la página a continuación
El clima de negocios
En Panamá

Alberto A. Alemán
Director - PROINVEX
•   Ubicación en el cruce de las Américas
                                               •   Abundante capital humano
•   Ubicación estratégica para el transbordo
                                               •   Costos operativos competitivos
•   Acceso a mercados internacionales vía
                                               •   Generosos incentivos de inversión
    acuerdos comerciales
                                               •   Sólido marco legal
•   Fuerza laboral habil y educada
                                               •   Acceso preferencial a mercados
•   Excelente infraestructrura de
                                               •   Favorable clima de negocios
    telecomunicación
                                               •   Excelente calidad de vida
•   Incetivos fiscales más competitivos
Nivel de Desarrollo
                          Económico

Potencial del país   Propuesta Única        Políticas nacionales
   para atraer         de Valor de           pro atracción de
   inversiones           Panamá                 inversiones

                     Ambiente de negocios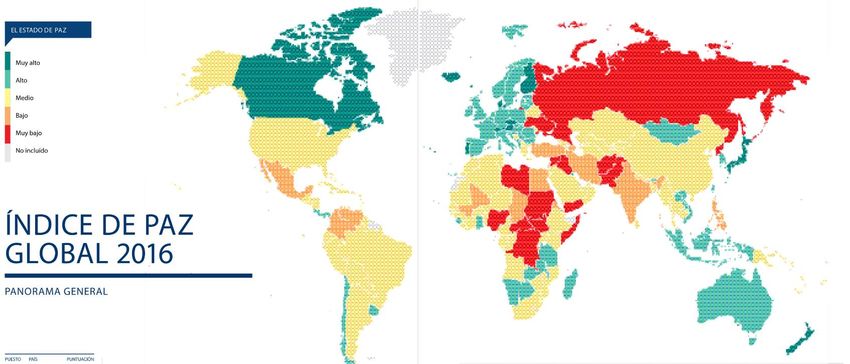
INFORMACIÓN GENERAL RECURSOS HUMANOS,
ATRACTIVIDAD PARA LA IED DISPONIBLIDAD, DESTREZAS
VENTAJAS DE UBICACIÓN SEGURIDAD
ESTRUCTURA, ESTABILIDAD Y CALIDAD DE VIDA
DINAMISMO GOBERNANZA
(CRECIMIENTO)ECONÓMICO ESTABILIDAD POLÍTICA
COMPETITIVIDAD ESTABILIDAD JURÍDICA
COSTOS (DE LA VIDA, SERVICIOS, IMPUESTOS
ETC.) REGÍMENES E INCENTIVOS
ACCESO A FINANCIAMIENTO Y ESPECIALES
CRÉDITO INVERSIONES GUBERNAMENTALES
SOLIDEZ DEL SISTEMA BANCARIO DIRECCIÓN ESTRATÉGICA DEL
MARCO LEGAL ESTADO
INFRAESTRUCTURA
Desarrollo
La atracción de IED no es
una metaeconómico
           en sí.     y
            social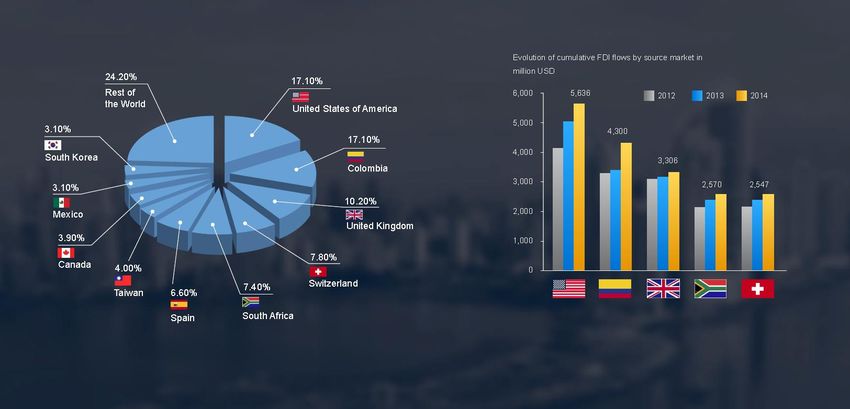
IED

EMPLEO DE CALIDAD   TRANSFERENCIA DE       TRANSFERENCIA DE           INYECCIÓN DE CAPITAL
 & CAPACITACIÓN      CONOCIMIENTOS            TECNOLOGÍA          & DIVERSIFICACIÓN ECONÓMICA

     INNOVACIÓN        DEMANDA POR             ENCADENAMIENTO &            COMPETENCIA
                       PRODUCTOS &               CLUSTERIZACIÓN
                     SERVICIOS LOCALES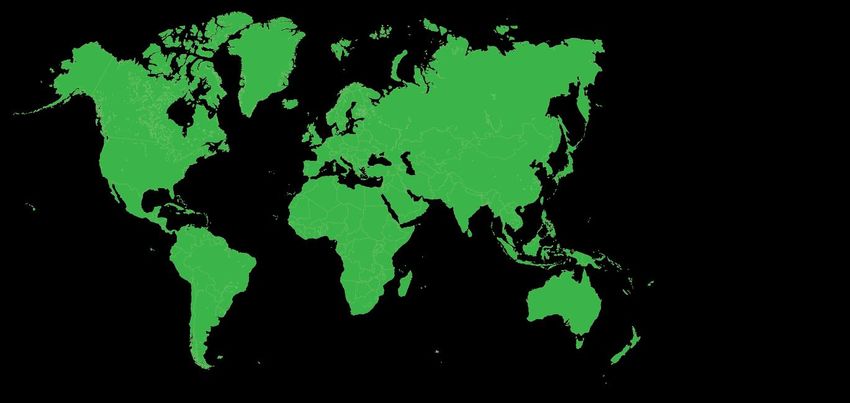
1. ¿Qué tipo de IED es mejor para impulsar el desarrollo
   económico y social?

2. Beneficios de la IED para Panamá

3. ¿Cómo maximizar dichos beneficios?

4. Políticas conducentes a la atracción de inversiones

¿Cuál es el Elemento
Clave de Nuestra
         Propuesta Única
                de Valor?
Panamá tiene los dos puertos más
activos de América Latina
En 2 océanos
1. Balboa: 3,468,283 TEU
Amsterdam (AMS)
Frankfurt (FRA)
2. Cristóbal: 3,286,736 TEU
Madrid (MAD) Estanbul (IST)
Tocumen tiene el número más alto de
vuelos directos internacionales, con acceso
directo a más de 85 destinos
110,306
106,140
90,844
71,716
66,350
Panamá San Juan Mexico City São Paulo Cancun
(PTY) (SIU) (MEX) (GRU) (CUN)
Conectividad continental via 7 cables
submarinos de fibra óptica
100% tráfico regional
97% Tráfico internacional de voz
9
90% transmisión de data electrónica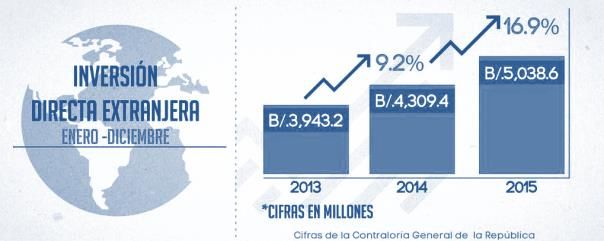
INVERSIÓN EXTRANJERA
DIRECTA
Panamá recibe la mayor proporción de IED
según el tamaño de su economía
9.7% PIB (2015)
5.038 mil millones USDPanamá recibe más de 45%
de la IED en Centroamérica
5 039La Inversión Extranjera Directa es elemento
fundamental la competitividad el Panamá
+6.5%
16.9% incremento de IED vs 2014 Q1-Q2
2016
B/.3,018.9
Más de 57% de la IED es reinversiónProyección de crecimiento compuesto
$30,000.00
$25,000.00 $24,013
$20,000.00
$17,572.00
$15,000.00
$12,858.00
$10,000.00
$9,409.00
$5,000.00 $6,885.00
$-
2016 2017 2018 2019 2020 2021 2022 2023 2024 2025$52,130,000,000
(PIB
Proyección de crecimiento compuesto 2015)
$30,000.00
$25,000.00 $24,013,0
$24,013
$20,000.00
$17,572.00
$15,000.00
$12,858.00
$10,000.00
$9,409.00
$5,000.00 $6,885.00 $15,146,000,000
$- (PIB 2005)
2016 2017 2018 2019 2020 2021 2022 2023 2024 2025La Inversión Extranjera crece Sectores con mayor IED en 2015: Comercio al por mayor y al por
menor (28%), Minería (18%), Actividades financieras (15%), Logística
en todos los sectores económicos (12%), Industria manufacturera (10%)
3,204
Los demás sectores
Sectores de mayor crecimiento del PIB en
Construcción
1,252 2014 2015
2,025 Logística, 4.70%
Explotación de minas y canteras
Energía, Gas y
2013 Agua, 13.60%
2,117
Suministro de electricidad, gas y agua
Construcción,
6.80%
2,463
Industria Manufacturera 2012
2,851
Información y Comunicación
3,044
Transporte, Almacenamiento y correo
8,274
Actividades Financieras y Seguros
Minería, 7.00%
10,045 Sector financiero,
Comercio al por mayor y por menor
10.40%
Bienes raíces,
0 4,000 8,000 12,000
6.10%
IED en Miles de US$Tendencias Históricas y Orígenes de la
Inversión en Panamá
12.60%ESTABILIDAD Y DINAMISMO ECONÓMICO
Crecimiento Del PIB De Panamá
Vs. Países De Referencia Y El Mundo

                         Los países de referencia                               Regiones                   6.3% 6.6%

                                                                                           4.3% 4.7%
                                                                               3.4% 3.6%
                                     2.6% 2.9%      2.6% 2.6%
                         1.7% 1.7%                                      1.6%
                  0.0%                                          -0.3%

            Brazil       Alemania      México         EEUU       America        Mundo      Emergente        Panamá
                                                                  Latina                                     Panamá
          -3.5%

                                                        2016    2017

                                                                                             Fuente: IMF y World Economic Outlook Report 2016.
FMI Ratifica Crecimiento Sustentado PANAMA
A 2020 Crecimiento PIB Real (% Variación Anual) AMLAT- CARIBE
MERCADOS EMERGENTES
MUNDO
14
6.1% in 2016 (p)
12
10
- 0.5% in 2016 (p) 8
6
4
2
0
2000 2005 2010 2015 2020
2016 -2Proyecciones de Crecimiento
y Grado de Inversión
Grado de BBB
Inversión Stable
BBB
Stable
Baa2
Stable
#5 En El Mundo Por Ahorro
Nacional Bruto (% PIB)COMPETITIVIDAD Y AMBIENTE DE NEGOCIOS
Factores de competitividad
de Panamá
Panamá supera el promedio competitividad de Latinoamérica Fortaleza del sector financiero
en todos los indicadores
Desarrollo de Mercado Financiero Posición
Global #12
Disponibilidad de Servicios Financieros para
los negocios
#5 #16
Accesibilidad a Servicios Financieros
#6 #18
Facilidad de acceso a préstamos
#8 #13
Solvencia de Bancos
#11 #11
Indicadores de fortaleza:
94 Bancos
+118.5 mil millones en activos a mayo 2016
Utilidades de 1.5 mil millones en 2015Ventajas Comparativas de
La Economía Panameña
Economía Dolarizada Sin Banco Sistema Fiscal
Desde 1904 Central Territorial
Solo los ingresos que se generan en el territorio panameño
están sujetos a impuestos localesPolíticas Estatales
Conducentes a la Inversión
Indicadores Ranking
Mundial
IED y Transferencia de Tecnología #5
Prevalencia De La Propiedad Extranjera #8
Impacto De Las Normas De Los Negocios En La IED #10
Efecto De Los Impuestos En Los Incentivos Para La Inversión #12
Desarrollo De Mercado Financiero #12
Adopción Tecnológica, Especialmente A Nivel Empresarial #27
Disponibilidad de Tecnología de Punta #31
Posición General WEF-ICG 2015-2016 #42 #50Regímenes Especiales
para facilitar la inversión
Fiscales Laborales
Área Económica Especial
Migratorios Aduaneros
Panamá ofrece un amplio margen de leyes
con incentivos orientados a diversos
sectores económicos.Panamá ofrece un ambiente
de inversión seguro y predecible
Estabilidad Jurídica de las Inversiones: Ley 54 de 1998
Promueve y protege las inversiones en Panamá en sus sectores
estratégicos de crecimiento
Establece un marco jurídico estable y predecible para la
inversión por un periodo de 10 años
Los inversionistas extranjeros tienen los mismos derechos y las
mismas obligaciones que las empresas y los inversionistas locales
Panamá, con su economía dolarizada, tiene uno de los índices de
$ inflación más bajos del mundo, a .2% (2014-2015)
Fuente: Instituto Nacional de Estadística y Censo (INEC)Políticas Estatales Conducentes a la Inversión
Infraestructura
de calidad mundial

    Panamá cuenta con la mejor infraestructura                                                                  Según el Índice de Competitividad Global del Foro
    de Centroamérica                                                                                            Económico Mundial 2016-2017 , Panamá se
     País                                                                                           Ranking     posiciona:
     PANAMÁ                                                                                              1

     Republica Dominicana                                                                            2
                                                                                                                                   #5 #7 Calidad de infraestructura
     Jamaica                                                                                    3                                  portuaria en el mundo
     Bahamas                                                                           4

     Puerto Rico                                                                  5
                                                                                                                                   #6 #6 Calidad de infraestructura
     Costa Rica                                                               6                                                    aeroportuaria en el mundo
     Antigua & Barbuda                                                   7

     Aruba                                                       8                                                                 #8 Subscripciones de telefonía móvil
     Granada                                               9                                                                       / 100 hab. (índice 174.2%)
     El Salvador                                  10

    *Fuente: Caribbean & Central American Countries of the Future 2013/14 (fDi Intelligence)1                 *Fuente: Foro Económico Mundial, Índice de Competitividad Global 2016-2017
    1 Nota:   Infraestructura se refiere al Internet, puertos y aeropuertos                                   *Fuente: Banco Mundial índice de Competitividad Logística 2016
Competitividad
Logística
#1 #2 América Latina en el Índice de
Competitividad Logística del Banco Mundial
#40 #52 MundialmenteAmplia Red
de Acuerdos Comerciales
20 Acuerdos
Alcance a 60 Países
Acceso a Mercados
con 1,300 MM
Consumidores
Poder Adquisitivo
+$29,000
per cápitaPanamá Está Entre Los Países Más Seguros Para
Visitar, Vivir, y Hacer Negocios
Ciudad de Panamá #1 en Centroamérica y
#3 en América Latina en calidad de vida
Fuente: Mercer, Quality of Living Ranking 2016
Panamá es el país más feliz del mundo y #1
por el bienestar de su gente
* Fuente: Gallup-Healthways Global Well-Being Index 2013 & 2014
#1 en Centroamérica y #4 en América
Latina en el Índice de Desarrollo
Humano
Fuente: PNUD, Índice de Desarrollo Humano 2015
Destino #1 en el mundo
para retirarse
Fuente: International Living, Global Retirement Index 2016
#1 en turismo en Centroamérica*, destino #1
para viajar en el mundo en 2016²
*Fuente: Foro Económico Mundial, Travel and Tourism Competitiveness Report 2015
*Source: FTI Consulting, Latin America Regional Security Index 2014 ² Fuente: Travel+Leisure, Best Places to Travel in 2016Talento y Recurso Humano
Meta 2019:
                                                   16,200
                                   Alumnos         maestros
                                   capacitados:    capacitados
                                   8,000           289,000
                  Niños            (After School   estudiantes
                  capacitados:     Program)        capacitados
                  1,400
                  (Kids Program:
Docentes          Kinder a 3er
                  Grado)
capacitados:
1,400
(600 localmente
y 800
Internacionalme
nte)
Demanda de empleo estimada por sector 2015-2020 OPORTUNIDAD Fuente: Estudio “El empleo, la productividad y la inclusión social con más y mejor formación técnica y profesional”
Desempeño
del Mercado Laboral
Labor Force (general statistics)
Labor force per economic sector in urban Panama region
20.8%
Labor Force 2015: 755,018 people
3.9% 11.5%
4.1%
4.8%
• Unemployment rate 2015: 5.4%
11.4%
4.8%
• Informal employment by 2015: 34.6%
4.8% 6.8% Country’s Health Care and Education System
5.2% 8.5%
5.8% 7.7% Active workers enrolled in Social Security
Wholesale & Retail Construction System: 1.16 million (2014)
Transport, Storage and communications Manufacture Industry
Public Sector Hotel & Restaurants
Health sector Household activities 12.6% Investment Plan will be allocated in
Education
Professional and Tecnicianactivities
Administration Activities
Financial and Insurance
education between 2015-2019.
9 other sectors
Source: National Institute of Statistics and CensusPopulation Growth In Panama Region
Estimations And Forecast Of Population In Panama % Growth On Population Per Age Segments
District Between 2010-2020 From 2010 To 2020 In Metropolitan Area
900 855
Age Segment % of Growth 2010-2020
800 0-14 years 1.6%
In Thousand of Inhabitants
677
700 15-64 years 26.3%
600
65+ 55.7%
500
400
300 248 252
200
100 Evolution On Total % Share On Age Segments Of Population
100 64
2010 Vs 2020 In Panama Metropolitan Area
0
2010 2011 2012 2013 2014 2015 2016 2017 2018 2019 2020
Age Segments 2010 2020 % Change on
0-14 years 15-64 years 65 and more total share
0-14 years 20.9% 25.1% +4.2%
15-64 years 70.8% 68.4% -2.4%
65+ 8.3% 6.5% -1.8%Wage Percentile Distribution
Per Occupation Position
*General Comptroller of the Republic
Office workers according to wages in Panama (Province), per
range of wage in percentage
Directors and Manager monthly wages in public and 0.7
private sector in Panama (Province), per range of wage in 7.5 Up to US$ 799
percentages 14.4
US$ 800 to 999
US$ 1000 to
1999
Up to US$ 999 US$ 2,000 to
2999
19.5 77.4
38.0 US$ 1000 to 1999
13.5 Technicians and professionals of mid level according to wages
US$ 2000 to 2999 in Panama (Province), per range of wage in percentages
29.0
4.2 4.8
US$ 3000 and more
Up to US$ 799
25.2 US$ 800 to 999
53.7 US$ 1000 to 1999
12.1
US$ 2000 to 2999
US$ 3000 and morePayroll
DETAIL CONTRIBUTIONS
EMPLOYER WORKER TOTAL
A. MANDATORY BENEFITS
Fee that amounts to 22% of salary and which is paid
to Social Security
1. SOCIAL SECURITY 12.25% 9.75% 22.00%
Fee amounting to 2.75% of salarty, exclusively for
2. EDUCATION INSURANCE educational purposes 1.50% 1.25% 2.75%
Mandatory contributio that varies between .81% and
5.67%, according to the risk involved in the
company´s activity, paid exclusively by the employer
3. PROFESSIONAL RISKS (average of 2.84%) 2.84% 2.84%
Additional remuneration to salary ammounting to
8.33% of wages paid by employers to workers for
4. XIII MONTH their contribution to the company´s benefits 8.33% 8.33%
Annual rest. Remuneration to which the worker is
entitled for 30 days out of every 11 month period of
5. VACATIONS continous work (1 for every 11 days of service) 9.09% 9.09%
Mandatory holidays (11 days per year are National
6. HOLIDAYS Holidays) and also National Mourning Days 3.51% 3.51%
Sick Leave Fund: entitles worker to be absent from
7. SICK LEAVE work 18 days a year due to illness 5.77% 5.77%
SENIORITY PREMIUM: Fund for years of services
8. SENIORITY PREMIUM provided: 1 week salary for every year of service
PROVISION FOR DISMISSAL
(RESERVE FUND FOR (1/52) x 100 = 1.923%
UNEMPLOYMENT = 2.25%)
Layoff provision:
3.4 week/52= 6.54% Indemn. 1 year
6.54% x 5% C.T. = 0.327 %
Then:1.923 + 0.327 = 2.25% 2.25% 2.25%
SUBTOTAL % FOR MANDATORY
CONTRIBUTIONS 45.29% 9.25% 54.54%Payroll
DETAIL CONTRIBUTIONS
EMPLOYER WORKER TOTAL
B. BENEFITS THAT ARE MANDATORY
DEPENDING ON SPECIAL CONDITIONS
30 day prior notification of dismissal is applicable in
cases outlined in article 212 of the Labor Code, being
at the discretion of the employer to comply with the
provision of a 30-day notice of dismissal or abandon
the corresponing sum of a month´s wages, in which
the case would be an amount equal to 8.33% of a
1. NOTICE year´s salary 8.33% 8.33%
Additional amount that the worker must receive for
continuous services provided in case the employment
relationship is indefinitely terminated or without prior
administrative approval when required. This varies
2. COMPENSATION according to time of service (highest case) 6.54% 6.54%
Subtotal %: BENEFITS THAT ARE
MANDATORY DEPENDING ON SPECIAL
CONDITIONS. IN THE CASE OF 2 YEARS
(higher case). 14.87% 14.87%Payroll taxes related to hiring expats under the Panama
Pacífico SEA
Labor Taxes in Panama Labor Tax to be paid by On Panama Pacífico SEA (1)
companies on fiscal territory
Social Security fee (%) 12.25% 0% Extra benefits for corporates to reduce
costs and increase productivity
XIII Month Social Security 0.90% 0%
Education Insurance 1.50% 0% One Stop Shop office with 17 Public
Professional Risk 2.10% 0% offices related to ease the process
Total 16.75% of doing business inside Panama
(1) Applies for corporate foreign staff with paid salaries from headquarters with no diplomatic status visa Pacifico and modern residential
area under expansion
Labor taxes to be retained by employers from expats employee salary Fixed rates for overtime (25%) and
Taxes to be paid by Employee Tax rate Panama Pacifico (1) Savings for employees work on employees’ day off (50%)
and flexibility to assign employees’
Social Security 9.75% 0% 9.75%
day off
XIII Month Social Security 0.60% 0% 0.6%
Education Insurance 1.25% 0% 1.25%
Companies may remain open on
Income Tax 25% 0% 25%
Sundays and holidays
Total 36.60% 36.60% of monthly salary
(1) If the work force income is paid from foreign sources due to international operations, and the company applies for an incentivized activity under law 41, 2004 and its consequent modifications.A su servicio… www.proinvex.mici.gob.pa @proinvexpma proinvexpanama@mici.gob.pa
También puede leer