Curvas de deshidratación del apio Arracacia
←
→
Transcripción del contenido de la página
Si su navegador no muestra la página correctamente, lea el contenido de la página a continuación
Rev. Fac. Agron. (LUZ). 2011, 28: 205-222

     Curvas de deshidratación del apio (Arracacia
   xanthorrhiza) y auyama (Curcubita maxima) y su
       efecto sobre las propiedades funcionales1

      Dehydration curves from the apio (Arracacia
 xanthorrhiza) and auyama (Curcubita maxima) and their
            effect on the functional properties
                L. Chaparro2 , J. Palmero3, T. García3 y Y. Terán3

      1
        Trabajo financiado por el CDCH-UCLA.
      2
        Laboratorio de Procesos Agroindustriales. Decanato de Agronomía.
      Universidad Centroccidental Lisandro Alvarado. (UCLA).
      Barquisimeto. 3001. Estado Lara, Venezuela.
      3
        Programa de Ingeniería Agroindustrial. Decanato de Agronomía.
      UCLA. Barquisimeto. 3001. Estado Lara, Venezuela.

                                     Resumen

      El estudio se realizó con el objetivo de caracterizar el proceso de secado en
muestras de apio (Arracacia xanthorrhiza) y auyama (Curcubita maxima) bajo
tres condiciones, y evaluar su efecto sobre las propiedades funcionales de las
harinas resultantes. Para conocer las características del proceso de secado, se
elaboraron curvas de deshidratación a diferentes temperaturas de bulbo seco (65,
75 y 85ºC), siendo la humedad de equilibrio de 6,02 y 5,6% (p/p) en base seca para
las muestras de apio y auyama, respectivamente. En cuanto a las propiedades
funcionales, los máximos valores obtenidos en el índice de absorción de agua
(IAA), fueron de 4,16 g de gel.g-1 en la harina de apio y 11,5 g de gel.g-1 en auyama,
incrementándose este último valor, a medida en que aumentaba la temperatura
del aire de secado. En cuanto al índice de solubilidad en agua (ISA), se obtuvo
valores máximos de 50% para la harina de auyama, disminuyendo hasta un 15%
a medida en que se aumenta la temperatura de deshidratación, efecto contrario
ocurrió en la muestra de harina de apio, en las que aumentaron los valores de 15
a 25% al incrementar la temperatura de secado.
Palabras clave: deshidratación, apio, auyama, preservación, secado.

Recibido el 20-1-2010 z Aceptado el 11-2-2011
Autor de correspondencia e-mail: luischaparro@ucla.edu.ve; luiscarloschaparro@gmail.com.

                                          205
Chaparro et al.
Abstract
The study was conducted to characterize the drying process in samples of
celery (Arracacia xanthorrhiza) and pumpkin (Curcubita maxima) under three
conditions, and evaluate its effect on the functional properties of the resulting
flour. To know the characteristics of the process of drying, dehydration curves
were prepared at different dry bulb temperatures (65, 75 and 85ºC), where the
equilibrium moisture content was of 6.02 and 5.6% (w/w) in dry weight for samples
of celery and pumpkin respectively. In terms of functional properties, the
maximum values obtained in the water absorption index (DAI) were of 4.16 g of
sample gel.g-1 celery in flour and 11.5 g of gel.g-1 pumpkin displays, increasing
the latter value, as they increased the temperature of drying air. As the water
solubility index (WSI) were obtained maximum values of 50% pumpkin flour,
decreasing to 15% as it increases the temperature of dehydration, the opposite
effect occurred in the sample of the celery’s flour, which increased the values of
15-25% by increasing the drying temperature.
Key words: dehydration, celery, pumpkin, preservation, drying.
Introducción Introduction
El consumo de raíces y tubércu- The consumption of roots and
los frescos en Venezuela posee un pa- fresh tubers in Venezuela has a
trón histórico muy distinto al de otros different historical pattern than other
rubros. Disminuye considerablemen- products. It reduces considerably with
te en los años en los cuales el ingreso the year, while the real rate of
real de la población aumenta, y luego population increases, and then the
se incrementa cuando este disminuye. production increases again, and the
Este comportamiento es modificado rate of population remains the same.
cuando los productos son procesados y This behavior is modified when
presentados en sus formas products are processed and presented
deshidratadas o mínimamente proce- in their dehydrated or minimal
sadas, lo cual es mas atractivo para el processed ways, which is more
consumidor, ya que estos mejoran su attractive for the consumer, since these
disponibilidad, aumentando su valor improve their availability, increasing
agregado, al ser mas "convenientes" the aggregated value by being more
desde el punto de vista de su costo o convenient, seeing from the point of
tiempo de preparación. (Machado- view of cost and preparation time
Allinson, 2007). (Machado-Allisom, 2007).
Motivado a esto, se ha creado la For this reason, it has been
necesidad de estimular la producción created the necessity of stimulate the
de rubros alimenticios locales, pres- production of local food products,
tando mayor atención a cultivos tropi- emphasizing in tropical crops for their
cales para su industrialización. Tal es industrialization. This is the case of
206Rev. Fac. Agron. (LUZ). 2011, 28: 205-222
el caso de raíces y tubérculos como la roots and tubers as celery’s root
raíz de arracacha o apio criollo, (Arracacia xanthorrhiza) and
(Arracacia xanthorrhiza), y la auyama pumpkin (Curcubita maxima), which
(Curcubita maxima), los cuales ofre- offer excellent economic perspectives
cen muy buenas perspectivas económi- and a great opportunity for the
cas y una gran oportunidad para el development of new products, due to
desarrollo de nuevos productos, por sus their nutritional advantages these
ventajas nutricionales ofrecen (Macha- products offer (Machado-allison, 2007)
do-Allinson, 2007). On the other hand, the food
Por otra parte, la industria pro- processing industry has applied
cesadora de alimentos ha aplicado pro- dehydration processes for this type of
cesos de deshidratación para este tipo raw material, because, when reducing
de materia prima, ya que al reducir el the humidity process the
contenido de humedad se previene el microorganisms growth is prevented
crecimiento de microorganismos y se and the others reaction that damage
minimizan las demás reacciones que the product are minimal, likewise the
los deterioran, así mismo, el secado de food dry process reduces the volume
los alimentos reduce su volumen y peso and weight, which influences
lo que influye en una reducción impor- importantly in the price, storage and
tante de los costos de empaque, alma- transport, since are stored in
cenamiento y transporte ya que per- environmental temperature for long
miten ser almacenados a temperatu- period of time (Fito et al., 2001). At
ra ambiente por largos períodos de the same time, the desiccation of ve-
tiempo (Fito et al., 2001). Así mismo, getal products is affected by different
la desecación de productos vegetales se factors such as: the retraction
ve afectada por factores como: la re- occurred in the solid, the
tracción ocurrida en el sólido, la caramelization (in products with high
caramelización (en productos con alta quantity of carbohydrates), the lipid
cantidad de carbohidratos), la fracción fraction present in the food; among
lipídica presente en el alimento; entre others, which impel the migration of
otros, los cuales impiden la migración some soluble compounds for the
de algunos compuestos solubles por las cellular walls that interact as a semi
paredes celulares que actúan como permeable membrane, influencing on
una membrana semipermeable, influ- the dry velocity and the final functional
yendo sobre la velocidad de secado y characteristics of the product.
las características funcionales del pro- Consequently, this research was done
ducto final. En función de esto, el pre- with the aim of characterizing the dry
sente trabajo se realizó con la finali- curves under dehydration conditions
dad de caracterizar las curvas de se- at 65, 75 and 95°C, and their effect
cado bajo condiciones de deshidratación under the functional properties in
a 65, 75 y 85°C y su efecto sobre las celery and pumpkin flours, as a
propiedades funcionales en harinas de processing alternative in the
apio y auyama, como alternativa de fabrication of products with non
procesamiento en la fabricación de pro- conventional raw matter, also it was
207Chaparro et al.
ductos con materias primas no conven- done with the purpose of posing
cionales, y plantear alternativas tec- technological alternatives that offer
nológicas que ofrezcan nuevas posibi- new commercial possibilities for this
lidades comerciales para este tipo de types of products.
rubro.
Materials and methods
Materiales y métodos
Processing
Procesamiento 3 kg of each material were
Se emplearon 3 kg de cada mate- employed, coming from the wholesale
rial, provenientes del mercado de ma- market of Barquisimeto (MERCABAR).
yorista de la ciudad de Barquisimeto Healthy material was selected at
(MERCABAR). Se seleccionaron al azar random, without any appreciable
materiales sanos, sin ningún tipo de damage, and with good consumption
daño apreciable, con características de quality characteristics, the materials
calidad de consumo, los cuales fueron were processed at the Processing
procesados en el laboratorio de Proce- Agroindustrial Laboratory of the
sos Agroindustriales de la Universidad “Centroccidental University Lisandro
Centroccidental Lisandro Alvarado Alvarado” (UCLA, following this
(UCLA), de acuerdo al siguiente esque- technological scheme: selection,
ma tecnológico: selección, clasificación classification and washing by
y lavado por inmersión en solución de immersion in a sodium hyplochloride
hipoclorito de sodio al 0,1%, escurrido, solution at 0.1%, drained, cut, peeled
picado, pelado, y rebanado en trozos de and sliced in pieces of 0.5 ± 0.1cm, then,
0,5 ± 0,1cm, para posteriormente rea- immersed in a citric acid solution at
lizar una inmersión en solución de 0.01% in order to avoid enzymatic
acido cítrico al 0,01%, a fin de de evi- browning. Finally, samples were
tar pardeamiento enzimático. Final- submitted to the dehydration process
mente, las muestras se sometieron a in a tray-type drier, at different dry bulb
deshidratación en un secador tipo ban- temperatures (65, 75 and 85°C) for four
deja, a diferentes temperaturas del hours. The air velocity was of 20m·s-1
bulbo seco (65, 75 y 85°C) durante 4 and the product weight of 1.5 kg of fresh
horas. La velocidad del aire fue de product, divided in three trays of 80X60
20m·s-1 y la carga de trabajo 1,5 kg de cm of area (0.48m2 ) and 0.5 cm of
producto fresco, repartidas en tres ban- thickness. Later, the dry samples were
dejas de 80x60 cm de área (0,48 m2) y processed in a grinder Alter Meck
un espesor de 0,5cm. Posteriormente, brand, and then were sift at 60mesh,
las muestras secas fueron procesadas equal to a 0.248 mm mesh. For the
en un molino de martillo Marca Alter statistical evaluation of the results,
Meck y luego tamizado a 60mesh, equi- three repetitions per essay were done
valente a una malla de 0,248 mm. to then perform the variance analysis
Para la evaluación estadística de los and comparison of means through the
resultados, se efectuaron tres repeti- multiple rank tests of Duncan, using
ciones en cada ensayo, para luego rea- S.A.S software, 8.1 version.
208Rev. Fac. Agron. (LUZ). 2011, 28: 205-222
lizar un análisis de varianza y compa- Determination of dry curves
ración de medias mediante la prueba The weight lost was measured in
de rangos múltiples de Duncan, utili- intervals of 30 min during the first dry
zando el programa S.A.S Versión 8.1. hour, and an hour after until reaching
Determinación de curvas de a total of four dehydration hours. The
secado initial humidity of the fresh material
Las pérdidas de peso fueron me- and the one of the dehydrated solid
didas en intervalos de 30min durante were determined according to the
la primera hora de secado y una hora method established by AOAC (1995).
después de este, hasta alcanzar un to- Solid Humidity (ns) and dry
tal de cuatro horas de deshidratación. velocity (-dns/dt).
La humedad inicial del material fres- The product humidity was
co y la del sólido deshidratado fue de- reported as the quantity of water per
terminada de acuerdo al método esta- unit of fresh food, employing the
blecido por la AOAC (1995). equation 1.
Humedad del sólido (ns) y veloci- ns=Psh - Pss/Pss (Eq. 1)
dad de secado (-dns/dt).
La humedad del producto fue re-
Expressed as (g H20.gss-1), where
portada como la cantidad de agua por
Psh is the wet solid mass, Pss the dry
unidad de alimento fresco, empleando
solid mass, and the difference between
la ecuación 1.
Psh-Pss is the water mass that the
ns=Psh - Pss/Pss (Ec. 1) food have at a determine time. The dry
solid mass (Pss) of the food was
Expresado como (g H 20.gss -1), determined by equation 2:
donde Psh es la masa del sólido húme-
do, Pss la masa del sólido seco y la di- Pss=((100-%humidity of the fresh) x
ferencia entre Psh-Pss es la masa de food) x Psho)/100 (Eq. 2)
agua que presenta el alimento a un
tiempo determinado. La masa del sóli- Where, Psh o is the wet solid
do seco (Pss) del alimento fue determi- mass at the beginning of the drying
nado por la ecuación 2: process or also called the initial load.
The drying velocity, expressed as g
Pss = (( 100 - % humedad del alimento H2 0.gss -1.h, was calculated as the
fresco) x Psho) / 100 (Ec. 2) humidity lost in the time unit (-dns/
Donde, Psho es la masa del sóli- dt) according to Krokida et al., (2003).
do húmedo al inicio del proceso de se- Finally, the functional properties were
cado o lo que es igual la carga inicial determined in function of the
de trabajo. La velocidad de secado, ex- absorption indexes (IAA) and water
presado como g H20·gss-1·h, fue calcu- solubility (ISA) posed by Anderson et
lado como la pérdida de humedad del al., (1989), for this reason 2 g of each
sólido en la unidad de tiempo, (-dns/ elaborated flours were weighted at the
dt) según Krokida et al; (2003). Final- three considered temperatures, and
mente, las propiedades funcionales se 20mL of distilled water at 30°C was
209Chaparro et al.
determinaron en función de los índi- added. Subsequently, it was moved for
ces de absorción (IAA) y de solubilidad 30 min and then centrifuged for 15
de agua (ISA) planteados por Anderson min at 300rpm, in a centrifuge
et al. (1969), para lo cual se pesaron Megafuge 16. The gel was weighted
2g de cada harina elaborada a las tres and in the supernatant were
temperaturas consideradas y se agre- determined the soluble substances. For
garon 20 mL de agua destilada a 30ºC. this, 10 mL of the suspension was let
Seguidamente, se agitó por 30 min y dried until a constant weight, on a
luego se centrifugó por 15 min a 3000 stove with forced air convection at
rpm en una centrífuga marca 90°C for 12h, then the following
Megafuge 16. Se pesó el gel y en el equations were applied:
sobrenadante se determinó las sustan-
IAAA (%)=Mass of the gel/mass
cias solubles. Para ello se dejó secar
of solid)/100 (Eq. 3)
hasta peso constante, 10 mL de la sus-
pensión en una estufa con convección ISA (%) = (masa de solid dis en
de aire forzado a 90ºC durante 12h sobrenadant/mass of original sample)
para luego aplicar las ecuaciones si- x 100 (Eq. 4)
guientes:
Results and discussion
IAA (%) = (masa del gel/masa del soli-
do) / 100 (Ec. 3)
Celery and Pumpkin
ISA (%) = (masa de sólid dis en Humidity in both fresh and
sobrenadante/masa de muestra origi- dehydrated phases
nal) x 100 (Ec. 4) Table 1 shows the average values
of the initial humidity at the fresh
Resultados y discusión stage in celery and pumpkin, as well
as the equilibrium humidity reached
Humedad del apio y auyama after the dehydration process at 65, 75
en estado fresco y deshidratado and 85ºC for four hours. The humidity
El cuadro 1 muestra los valores percentage in a dry phase of both
promedios de las humedades iniciales vegetables in a fresh phase was of
en estado fresco de las muestras de apio 70.11% and 80.25% respectively. In the
y auyama, así como las humedades de specific case of celery, the equilibrium
equilibrio alcanzadas luego del proce- humidity reached after the
so de deshidratación a 65, 75 y 85°C dehydration process at 65, 75ºC formed
por cuatro horas. El porcentaje de hu- a homogenous group that does not
medad en base seca de ambos vegeta- represent differences at a significance
les en estado fresco fue de 70,11% y level of P≤0.05, but was significantly
80,25%, respectivamente. En el caso higher than the obtained at 85ºC. It is
del apio, las humedades de equilibrio important to mention that the
alcanzadas después del proceso de des- equilibrium humidity values obtained
hidratación a 65 y 75ºC, formaron un for pumpkin samples, showed
grupo homogéneo que no presentan significant differences in all the applied
210Rev. Fac. Agron. (LUZ). 2011, 28: 205-222
Cuadro 1. Humedad de las muestras ensayadas de Apio y Auyama en
estado fresco y deshidratadas.
Table 1. Humidity of the essayed sampled of celery and pumpkin in
both the fresh and dehydrated stages.
Humedad de equilibrio bh (%)1
Vegetal Humedad inicial (%) 65°C 75ºC 85ºC
Apio 70,11±0,2 10,07±0,04a 10,71±0,01a 6,02±0,23b
Auyama 80,25±0,1 11,81±0,12a 9,90±0,5b 5,6±0,5c
1
Humedad del vegetal después del proceso de deshidratación a 65, 75 y 85ºC. Letras diferente
denotan diferencias significativas en la prueba de comparación de medias de Duncan a un
μ=0,05.
diferencias a un nivel de significancia dry temperatures, obtaining a
de P≤0,05, pero son significativamente humidity reduction even in 73% when
mayores a la obtenida a 85ºC. Es im- using a temperature of 85ºC. This
portante resaltar que los valores de behavior is reported by Fito et al.,
humedad de equilibrio logrados para (2001), when mentioning that food with
las muestras de auyama, mostraron a superior humidity than the
diferencias significativas en todas las intermediate (75%) are more suscepti-
temperaturas de secado aplicadas, lo- ble to humidity changes, by having a
grando una disminución de humedad higher quantity of released water and
hasta en un 93% al utilizar una tem- by obtaining equilibrium humidity
peratura de 85ºC. Este comportamien- different for each temperature level.
to es reportado por Fito et al. (2001), Changes of the solid
al señalar que los alimentos con hu- humidity based in time and using
medad superior a la intermedia (75%) different drying temperatures
son más susceptibles a los cambios de In figures 1 and 2, are presented
humedad, por tener mayor cantidad de the means of the humidity fractioned
agua libre y lograr humedades de equi- values at the dry stage of the solid (Xbs)
librio diferentes para cada nivel de (g H 2 O.gss -1 ) during 4h in the
temperatura. dehydration process in celery and
Cambios de la humedad del pumpkin respectively. In both figures,
sólido con respecto al tiempo uti- it is observed a significant reduction
lizando diferentes temperaturas of Xbs in all the evaluated
de secado temperatures, even under the initial
En las figuras 1 y 2 se presentan value of the solid. Also, humidity
las medias de los valores de fracciones values were observed, similar in both
de humedad en base seca del sólido samples for temperatures of 65 and
(Xbs) (g H2O·gss-1) durante 4 h proceso 75ºC during the first dry hour, being
de deshidratación en apio y auyama even faster in the drying curve at 85ºC.
211Chaparro et al.
65ºC 75ºC 85ºC
2,50
2,00
ns (gH20∙g.ss -1 )
1,50
1,00
0,50
0,00
0 0,5 1 2 3 4
Tiempo (h)
Figura 1. Cambios en la humedad de las muestras de apio ensayadas
durante el proceso de deshidratación.
Figure 1. Humidity changes in the essayed celery samples during the
dehydration process.
respectivamente. En ambos gráficos se On the other hand, the Xbs fall is more
observa una disminución significativa moderate (less pendent) after the second
de la Xbs en todas las temperaturas drying hour, maybe due to the
evaluadas, inclusive por debajo de la difficulty of dragging water that the
mitad del valor inicial del sólido. Se drying air has by the reduction of
observaron valores de humedad final released water in the solid surface, as
similares en ambas muestras para las mentioned by Krokida et al., 2003, in
temperaturas de 65 y 75ºC durante la essays with roots ‘dehydration.
primera hora de secado siendo más The changes in Xbs in celery
rápida aún, en la curva de secado a samples (figure 1) show that at the
85ºC. Por otra parte, la caída de Xbs second drying hour, the dehydration
es más moderada (menor pendiente) a profiles at 65 and 75ºC were of 0.558
partir de la segunda hora de secado, gH2 O.gss-1. In spite of the similar
posiblemente causado por la dificultad drying trajectory at 75 and 85ºC
de arrastre de agua que tiene el aire during the first half hour, were
de secado por la disminución de agua obtained, in both cases, different
libre en la superficie del sólido tal como equilibrium humidity contents, but for
lo señala Krokida et al; 2003 en ensa- the temperature of 65ºC, where it is
yos de deshidratación con raíces. finally obtained the same equilibrium
212Rev. Fac. Agron. (LUZ). 2011, 28: 205-222
65ºC 75ºC 85ºC
9,00
8,00
7,00
6,00
ns (gH2O∙gss -1)
5,00
4,00
3,00
2,00
1,00
0,00
0 0,5 1 2 3 4
Tiempo (h)
Figura 2. Cambios en la humedad de las muestras de auyama ensayadas
durante el proceso de deshidratación.
Figure 2. Humidity changes in the essayed samplesof pumpkin during
the dehydration process.
Los cambios en la Xbs en las Xbs at 75ºC (10.7% bh). In relation to
muestras de apio (figura 1) muestran humidity changes in pumpkin samples
que a la segunda hora de secado, los (figure 2), during the first drying hour
perfiles de deshidratación a 65 y 75ºC a reduction un all considered
fueron de 0,558 gH2 O·gss-1 . A pesar de temperatures was registered, later was
la similar trayectoria de secado a 75 y less marked two hours after and
85ºC durante la primera media hora, reached the equilibrium humidity
en ambos casos se logró contenidos de after three hours of dryness (0.182
humedad de equilibrio diferentes, no gH2O.gss-1).
así para la temperatura de 65ºC, en la Changes in the drying
que finalmente se obtiene la misma Xbs velocity of the celery samples in
de equilibrio que el tratamiento a 75ºC function of humidity fraction at
(10,7% bh). En cuanto a los cambios solid phase (Xbs).
de la humedad en las muestras de In figures 3 (A), 3 (B) and 3 (C),
auyama (figura 2), durante la prime- are observed the experimented changes
ra hora de secado fue registrada una by the dryness velocity in function of
disminución en todas las temperatu- Xbs, during the dehydration of celery.
ras consideradas, para luego hacerse In figure 3 (A) are evidenced two
menos acentuada después de transcu- drying areas. Area I (constant velocity),
213Chaparro et al.
rrida la segunda hora, y alcanzar la where it is supposed that the total
humedad de equilibrio a la tercera hora exposed surface of solid is saturated of
de secado (0,182 gH2 O·gss-1). water, and the water movement from
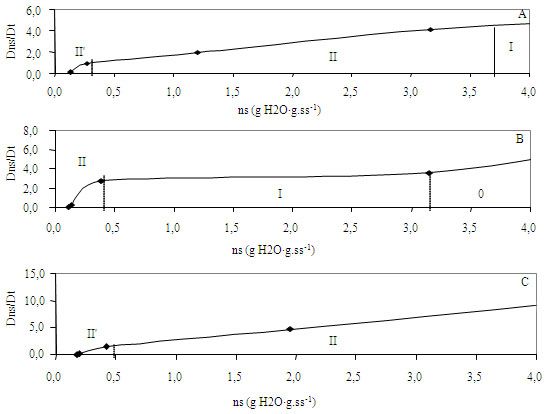
Cambios de la velocidad de its interior until the surface may be
secado de las muestras de apio occurring at the same evaporation
ensayadas en función de su frac- velocity (1.15 gH2 0.gss-1x h), which
ción de humedad en base seca caused a reduction of Xbs from 1.8 to
(Xbs). 1.5 gH20.gss-1, reducing 4% in relation
En las figuras 3(A), 3(B) y 3(C) to the initial value. In area II, is
se observan los cambios experimenta- observed an evident reduction of the
dos por la velocidad de secado en fun- drying velocity; possibly caused to solid
ción de la Xbs, durante la deshidrata- structures, fibrous or amorphous of
ción de las muestras de apio. solids, the liquid’s movement mainly
En la figura 3(A) se evidencian occurs by diffusion, therefore, it is pro-
dos zonas de secado. La zona I (veloci- bable that it has short terms of
dad constante), donde se supone que constant velocity (Krokida et al.,
la superficie total expuesta del sólido 2003). On the other hand, Vizcarrondo
está saturada de agua y el movimien- et al. (2006) mentions that the
to del agua desde el interior del mismo diffusion from the interior cannot
hasta la superficie podría estar ocu- provide all the liquid that would
rriendo a la misma velocidad de eva- evaporate in the surface; consequently,
poración, (1,15 gH2 0·gss-1 x h), lo que the water transfer’s velocity from the
ocasionó una disminución de la Xbs de surface to the dragging area reduces.
1,8 a 1,5 gH20·gss-1, disminuyendo en In this second area, the Xbs humidity
un 4% respecto al valor inicial. En la reduced in 95%, which means that the
zona II se observa una evidente dismi- highest part of the drying process
nución de la velocidad de secado; posi- could have been controlled by the
blemente debido, a que en estructuras velocity of the liquid diffusion.
sólidas, fibrosas o amorfas de sólidos, The dehydration profile for celery
el movimiento del líquido principal- samples at 75ºC evidenced three
mente ocurre por difusión, por lo tan- characteristics, the induction area, the
to es probable que tenga períodos cor- constant velocity and the decreasing
tos de velocidad constante (Krokida et velocity, as observed in figure 3 (B).
al., 2003). Por otra parte, Vizcarrondo After the induction period, the drying
et al. (2006) señala que la difusión des- mechanisms were stabilized due to the
de el interior, no puede suministrar equality between the evaporation
todo el líquido que se evaporaría en la velocities and the water diffusion
superficie, en consecuencia, la veloci- towards the surface (Rodríguez et al.,
dad de transferencia de agua de la su- 2006). The Xbs reduction that was
perficie al medio de arrastre disminu- obtained during this second phase (50%
ye. En esta segunda zona, se logró dis- of Xbs of the previous phase) initiated
minuir la Xbs de humedad en un 95%, the decreasing velocity period, where
lo cual significa que la mayor parte del finally reduced in 95% the Xbs
proceso de secado estuvo controlado po- humidity of the solid until reaching
214Rev. Fac. Agron. (LUZ). 2011, 28: 205-222
1,4
A
1,2
1,0
Dns/Dt
0,8
0,6 I
II
0,4
0,2
0,0
0,0 0,5 1,0 1,5 2,0 2,5 3,0 3,5 4,0
ns (g H2O∙g.ss-1)
2,0
B
1,8
1,6
1,4
Dns/Dt
1,2
1,0
0,8
0,6
0
0,4
I
0,2 II
0,0
0,0 0,5 1,0 1,5 2,0 2,5 3,0 3,5 4,0
ns (g H2O∙g.ss-1)
2,5
C
2,0
Dns/Dt
1,5
1,0
0,5 II
II '
0,0
0,0 0,5 1,0 1,5 2,0 2,5
ns (gH2O∙g.ss -1)
Figura 3. Cambios de la velocidad de secado con respecto a la Xbs de
humedad del sólido durante el proceso de deshidratación de
las muestras de apio ensayadas a 65 (A), 75 (B) y 85°C (C).
Figure 3. Changes on the dry velocity in relation to the Xbs of the solid
humidity during the dehydration process of essayed celery
samples at 65 (A), 75 (B) and 85°C (C).
siblemente por la velocidad de difusión 0.12 gH2 0.gss-1. Regarding the perfor-
del líquido. mance of the dehydration process for
El perfil de deshidratación de las celery samples at 85ºC, was only seen
muestras de apio a 75ºC evidenció tres a period of decreasing velocity, which
zonas características, la zona de induc- initiated at a dry velocity of 2.1
ción, de velocidad constante y la de ve- gH2 0.gss x h, until values of Xbs of 0.47
locidad decreciente, tal como se obser- gH 2 0.gss -1 , to reduce slowly (0.7
va en la figura 3(B). Luego del periodo gH 2 0.gss x h). This behavior is
215Chaparro et al.
de inducción, el mecanismo de secado reported by Quiñones et al., (2007)
se estabilizó debido a la igualdad entre when mentioning that the
las velocidades de evaporación y difu- characteristic patter of the drying
sión del agua hacia la superficie curves of vegetables with high starch
(Rodríguez et al., 2006). La reducción content; dehydrated at high
de Xbs que se logró en este segundo pe- temperatures, show only one period of
riodo (50% de Xbs del periodo anterior), decreasing velocity due to the great
dió inicio al periodo de velocidad decre- strength of dryness by the high applied
ciente, en el cual se redujo finalmente temperatures.
en un 95% la Xbs de humedad del sóli- Changes in the drying
do hasta alcanzar 0,12 gH20·gss-1. En velocity in function of Xbs of the
cuanto al desempeño del proceso de des- solid humidity during the
hidratación para las muestras de apio dehydration process in pumpkin
a 85°C, se apreció un solo periodo de samples
velocidad decreciente, cual se inicia a In figures 4 (A) and 4 (C) are
una velocidad de secado de 2,1 gH20.gss shown the average values of the drying
x h, hasta valores de Xbs de 0,47 velocity during the dehydration process
gH20·gss-1, para luego disminuir con of the evaluated pumpkin samples.
más lentitud (0,7 gH20·gss x h) los has- The drying process at 65ºC (figure 4
ta 0,40 gH20·gss-1. Este comportamien- A) had as main characteristic the
to es reportado por Quiñones et al. presence of three drying periods; one
(2007) al señalar que el patrón caracte- of constant velocity and two with
rístico de las curvas de secado de vege- decreasing velocity. The area of
tales con alto contenido de almidón; constant velocity had average values
deshidratados a altas temperaturas, of 5.33 gH2O.gss -1 x h, which allow
muestran un solo periodo de velocidad reducing the Xbs of the solid, from 4
decreciente, debido a la gran fuerza to 3.65 gH2 O.gss-1 equivalent to a
impulsora de secado por las altas tem- humidity reduction of 3% in solid, in
peraturas aplicadas. the first haf hour of the drying process.
Cambios de la velocidad de The rest of the Xbs (65%) was remo-
secado en función de la Xbs de ved during the decreasing period and
humedad del sólido durante el reduced from 5.1 to 0.274 gH2O.gss-1.
proceso de deshidratación de las It is noteworthy that the humidity
muestras de auyama reduction in this area occurred in two
En las figuras 4(A), 4(B) y 4(C), se sections, which is generally
muestran los valores promedios de la characteristic in solids which
velocidad de secado durante el proceso transportation mechanism of
de deshidratación de las muestras de humidity occurs by diffusion (Krokida,
auyama evaluadas. El proceso de seca- 2003).
do a 65ºC, (figura 4 A), tuvo como carac- Figure 4 (B) shows three drying
terística principal, la presencia de tres areas, where are included periods of
períodos de secado; uno de velocidad cons- induction, constant velocity and
tante y dos de velocidad decreciente. La decreasing velocity. In the constant
zona de velocidad constante comprendió velocity area, was observed a
216Rev. Fac. Agron. (LUZ). 2011, 28: 205-222
Figura 4. Cambios de la velocidad de secado con respecto a la humedad
del sólido durante el proceso de deshidratación del Auyama a
65 (A), 75 (B) y 85ºC (C).
Figure 4. Changes in the dry velocity in relation to the humidity of the
solid during the dehydration process of pumpkin at 65 (A), 75
(B) and 85°C (C).
valores promedios de 5,33 gH2O.gss-1 x significant reduction of Xbs of the solid
h, lo que permitió disminuir la Xbs del from 3.1 to 0.13 gH2O.gss-1 equivalent
sólido de 4 a 3,65 gH2O.gss-1 equivalen- to 96% of the initial humidity, much
te a una reducción de humedad de un higher in relation to the constant velocity
3% en el sólido en la primera media hora period for 65ºC (35%). The decreasing
del proceso de secado. El resto de la Xbs velocity period initiated with the critical
(65%) fue removida durante el período humidity of the soil (0.13 gH2O.gss-1),
de velocidad decreciente y disminuyó de until reaching an equilibrium humidity
5,1 a 0,274 gH2O.gss-1. Hay que señalar of 0.11 gH2O.gss-1. With the drying
que la disminución de la humedad en phase at 85ºC, (figure 4 C), the
esta zona ocurrió en dos secciones, lo cual dehydration profile only presented two
generalmente es característico en sóli- decreasing velocity periods. The first
dos cuyo mecanismo de transporte de hu- phase initiated with a velocity of 9.02
medad ocurre por difusión (Krokida, gH 2 O.gss -1 x h, with a moderate
2003). descent of velocity in a lineal pendent
La figura 4(B), muestra tres zo- in relation to the Xbs of the solid, after
217Chaparro et al.
nas de secado en el que se incluye el this, a sudden fall of the drying velocity
periodo de inducción, de velocidad cons- happened when Xbs was of 0.41
tante y el decreciente. En la zona de gH2 O.gss-1, until was reached the
velocidad constante se observó una dis- equilibrium humidity of 0.06 gH2O.gss-
minución significativa de la Xbs del 1
or 5.6% of humidity, in humid based.
sólido de 3,1 a 0,13 gH2O.gss-1 equiva- Effect of the dehydration
lente a un 96% de la humedad inicial, treatments on the functional
mucho mayor con respecto al periodo properties on samples of celery
de velocidad constante para 65ºC and pumpkin flour
(35%). El periodo de velocidad decre- The effect of three drying
ciente se inició con la humedad crítica temperatures was evaluated based in
del sólido (0,13 gH2O.gss-1), hasta que the water absorption index (IAA) and
se llegó a la humedad de equilibrio de the aqueous solubility index (ISA) on
0,11 gH2O.gss-1 . Con respecto al seca- samples of celery and pumpkin flours
do a 85ºC, (figura 4 C), el perfil de des- obtained during the essays.
hidratación solo presentó dos período In relation to the IAA values, the
de velocidad decreciente. La primera behavior for both flour samples was
etapa se inició con una velocidad de 9,02 similar for a temperature of 65°C,
gH2O.gss-1 x h, con un descenso mode- differentiating at the time that
rado de la velocidad en una pendiente increased the dehydration temperature
lineal con respecto a la Xbs del sólido, (figure 5).
luego del cual ocurrió una caída súbi- For the specific case of samples
ta de la velocidad de secado cuando la of celery flour, the behavior showed a
Xbs fue de 0,41 gH2 O.gss-1, hasta que reduction on the retention capacity of
se alcanzó la de humedad de equilibrio water, at the time that the temperature
de 0,06 gH2O.gss-1 ó 5,6% de humedad increased; this behavior is explained
en base húmeda. by Quiñones et al. (2007) saying that
Efecto de los tratamientos de when dehydrating cassava samples by
deshidratación sobre las propie- convention, the amylose molecules
dades funcionales de las muestras interact between them forming
de harina de apio y de auyama another structure, which possibly
Se evaluó el efecto de los tres ni- impelled the water absorption; the
veles de temperatura de secado sobre opposite case occurs in pumpkin flour,
el Índice de absorción de agua (IAA) e while at the time the dehydration
índice de solubilidad acuosa (ISA) de process took place at higher
las muestras de harina de apio y de temperature, a higher index of water
auyama obtenidas durante los ensayos. absorption was reported (11.5 g
En cuanto a los valores de IAA, gel.gsample -1 ). The chemical
el comportamiento para ambas mues- composition of the original product
tras de harina fue similar para una may be one of the reasons that could
temperatura de 65ºC, diferenciándose explain this behavior, and as
a medida en que se aumentó la tempe- mentioned by Rincón et al. (2000)
ratura de deshidratación (figura 5). besides the starch structures, there are
Para el caso de las muestras de other molecules more resistant to
218Rev. Fac. Agron. (LUZ). 2011, 28: 205-222
harina de apio, el comportamiento thermal treatments (mostly pectin)
mostró una disminución de la capaci- able to retain water and reduce at the
dad de retención de agua a medida que time that are dehydrated.
aumentó la temperatura; este compor- In relation to the index values of
tamiento es explicado por Quiñones et the obtained aqueous solubility (figu-
al. (2007) al señalar que al deshidratar re 6), these showed an inverse
muestras de yuca por convección, las behavior than the tendencies observed
moléculas de amilosa, interactúan en- in results of IAA in both flour samples.
tre sí formando otra estructura, la cual When applying a drying sample at
posiblemente impidió la absorción de 65%, index values were obtained of
agua; caso contrario ocurre con la ha- aqueous solubility at 50% for pumpkin
rina de auyama, la cual a medida que samples, reducing until 15% in the
la deshidratación se llevó a cabo a elaborated at drying temperatures of
mayor temperatura, se reportó mayor 85ºC. Likewise, samples of celery flour
índice de absorción de agua (11,5 g increased their ISA levels from 15 to
gel.gmuestra-1). La composición quími- 25% when increasing the drying
ca del producto original podría ser una temperature. This could has been
de las razones que explica este com- possible produced by thermal
portamiento, es así como según lo se- hydrolysis of the starch chains,
ñalado por Rincón et al. (2000) además becoming in smaller structures,
de las estructuras de almidón, existen reducing the capacity of trapping water
otras macromoléculas más resistentes as mention by Rodríguez et al. (2006).
Apio Auyama
12
10
g gel∙g muestra -1
8
6
4
2
0
60 65 70 75 80 85 90
Tempera tura (ºC)
Figura 5. Índice de absorción de agua en muestras de harinas de Apio y
Auyama deshidratadas a 65, 75, y 85ºC.
Figure 5. Absorption water index in dehydrated flours of celery and
pumpkin at 65, 75 and 85°C.
219Chaparro et al.
a los tratamientos térmicos (en su Conclusions
mayoría pectinas) capaces de retener
agua y aumentar su potencial a medi- The drying conditions at 65, 75
da en que son deshidratadas. and 85ºC affected significantly the
En relación a los valores de índi- descend of XVs of the solid humidity,
ce de solubilidad acuosa obtenidos (fi- as well as the velocity and the drying
gura 6), estos arrojaron un comporta- time in celery and pumpkin samples
miento inverso a las tendencias que se that were essayed, also, the functional
observaron en los resultados de IAA en characteristics in terms of water
ambas muestras de harina. Al aplicar absorption index and aqueous solubility
una temperatura de secado de 65ºC se index in samples of flours.
obtuvieron valores del índice de The drying process in celery and
solubilidad acuosa de 50% para las pumpkin samples at 65, 75 and 85ºC
muestras de harina de auyama, dis- showed clearly two decreasing velocity
minuyendo hasta un 15% en las ela- periods, which indicates that the processed
boradas a temperatura de secado de samples have internal structures that
85ºC. Así mismo, las muestras de ha- regulate the propagation of the water
rina de apio aumentaron sus valores molecules at the center of the solid.
de ISA de 15 a 25% al incrementar la The best dehydration conditions,
temperatura de secado. Este efecto po- obtained in this research for both
siblemente se produjo por hidrolisis vegetables under essay allowed
térmica de las cadenas de almidón, obtaining results in relation to
Apio Auyama
55
50
45
40
35
%
30
25
20
15
10
60 65 70 75 80 85 90
Temperatura (ºC)
Figura 6. Índice de solubilidad en agua en muestras de harinas de Apio
y Auyama deshidratadas a 65, 75, y 85ºC.
Figure 6. Solubility index in water, in samples of dehydrated celery
and pumpkin flours at 65, 75 and 85°C.
220Rev. Fac. Agron. (LUZ). 2011, 28: 205-222
convirtiéndose en estructuras más pe- functional characteristics of flours,
queñas, disminuyendo su capacidad de and reaching the Xbs of equilibrium
atrapar las moléculas de agua tal como humidity in less time, were: to initiate
lo señala Rodríguez et al. (2006). the dehydration process at 80ºC for two
hours and to end the process at 65ºC
Conclusiones for an hour.
There is an evident potential, for
Las condiciones de secado a 65, its agroindustrial application, of
75 y 85ºC afectaron significativamente pumpkin samples processed at 85ºC,
el descenso de Xbs de humedad del só- compared to celery flour, due to its high
lido, la velocidad y tiempo de secado rehydration capacity (11.5 g gel.g
en las muestras de apio y auyama que sample-1), particularly for dehydrated
fueron ensayadas, así como las carac- products or as complements in the
terísticas funcionales en términos de formulation of products that require
índice de absorción de agua e índice de this property.
solubilidad acuosa de las muestras de
sus harinas. End of english version
El proceso de secado en las mues-
tras de Apio y Auyama procesadas a
65, 75 y 85ºC mostraron claramente
dos periodos de velocidad decreciente,
lo cual indica que las muestra proce- como complemento en la formulación
sadas poseen estructuras internas que de productos que requieran esta pro-
regulan la propagación de las molécu- piedad.
las de agua en el seno del sólido.
Las mejores condiciones de des- Literatura citada
hidratación arrojadas en este estudio
Anderson, R.A. 1982. Water absortion and
para ambos vegetales en ensayo, que solubilitily characteristics of roll-
permitieron obtener buenos resultados cooked small grain products. Cereal
en cuanto a características funciona- Chem. 5 (9): 25-27
les de sus harinas y alcanzar las Xbs AOAC. 1995. Official method of analytical
de humedades de equilibrio en menos Chemists 16th edition. Washington
D.C.
tiempo fueron: iniciar el proceso de
deshidratación a 80ºC durante dos ho- Fito, P., A. Andrés, J.M. Barat y A. Albors.
2001 Introducción al secado por aire
ras y finalizar el proceso a 65ºC por caliente. Editorial Universidad
una hora. Politécnica de Valencia, España. p.
Existe un evidente potencial 250-275
para su aplicación agroindustrial de Krokida, M. K., V.T. Karathanos, Z.B.
las muestras de la harina de auyama Maroulis y D. Marinos-Kouris. 2003.
Drying kinetics of some vegetables.
procesadas a 85ºC, en comparación Journal of Food Engineering: 59(4):
con la harina de apio, debido a su ele- 391-403.
vada capacidad de rehidratación
Machado-Allison C. 2007. Consumo de
(11,5 g gel.g muestra-1), en particu- alimentos en Venezuela. Editorial.
lar para productos deshidratados o IESA S.A. Caracas. p. 460-468.
221Chaparro et al.
Maldonado, R. y E. Pacheco. 2003. Curvas de Rodríguez, E., A. Fernández., L. Alonso y B.
deshidratación del brócoli (Brassica Ospina. 2006. Reología de
oleraceae L. var. Italica Plenk) y suspensiones preparadas con harina
coliflor (Brassica oleraceae L var. precocida de yuca. Ingeniería &
Botrytis L). Rev. Fac. Agron. LUZ. Desarrollo. 19 (5):17-30.
20. (3): 306-319.
Singh, P. y D. Heldman. 1997. Introducción a
Quiñones, R., C. González y D. Polanco. 2007. la ingeniería de los alimentos. Ed.
Evaluación de diferentes tipos de Acribia, S.A. Zaragoza, España. p. 16.
deshidratación de raíz y follaje de yuca
amarga (Manihot esculenta) sobre su Vizcarrondo, L., C. Rincón, A. Rincón y F.
composición química. Zootecnia Trop. Padilla. 2006. Evaluación de harinas
25 (1): 43-49. y almidones de mapuey (Dioscorea
trifida), variedades blanco y morado.
Rincón, A y M. Araujo. 2000. Evaluación del Arch Latinoam.Nutr. 56(4):375-383.
posible uso tecnológico de algunos
tubérculos de las dioscoreas: ñame
congo (Dioscorea bulbífera ) y
mapuey (Dioscorea trifida). ALAN.
50 (3): 26-29
222También puede leer