TENDENCIAS Y PROYECCIONES DE LA INDUSTRIA DE TURISMO Y VIAJES EN AUSTRALIA, BRASIL, CHINA, COREA DEL SUR, INDIA, JAPÓN Y RUSIA - PromPerú

Página creada Sancho Valenciano
 
SEGUIR LEYENDO
TENDENCIAS Y PROYECCIONES DE LA INDUSTRIA DE TURISMO Y VIAJES EN AUSTRALIA, BRASIL, CHINA, COREA DEL SUR, INDIA, JAPÓN Y RUSIA - PromPerú
TENDENCIAS Y PROYECCIONES DE LA INDUSTRIA DE
                        TURISMO Y VIAJES EN AUSTRALIA, BRASIL, CHINA,
                        COREA DEL SUR, INDIA, JAPÓN Y RUSIA.
                        Un reporte compilado por Euromonitor International
                        para PromPerú
                        Marzo 2016

© Euromonitor International Ltd 2016. All rights reserved. The material contained in this document is the exclusive property of Euromonitor International Ltd and its licensors and is
provided without any warranties or representations about accuracy or completeness. Any reliance on such material is made at users’ own risk. This document is confidential and for
internal use by PromPerú and its affiliates only. Publication or making available to any third party of all or part of the material contained in this document (or any data or other material
derived from it) without Euromonitor’s express written consent is strictly prohibited. Please refer to the applicable terms and conditions with Euromonitor.
TENDENCIAS Y PROYECCIONES DE LA INDUSTRIA DE TURISMO Y VIAJES EN AUSTRALIA, BRASIL, CHINA, COREA DEL SUR, INDIA, JAPÓN Y RUSIA - PromPerú
INTRODUCCIÓN
RESUMEN EJECUTIVO
TAMAÑOS DE MERCADO
DISTRIBUCIÓN
CONSUMIDORES
PREGUNTAS
TENDENCIAS Y PROYECCIONES DE LA INDUSTRIA DE TURISMO Y VIAJES EN AUSTRALIA, BRASIL, CHINA, COREA DEL SUR, INDIA, JAPÓN Y RUSIA - PromPerú
INTRODUCCIÓN | RESUMEN EJECUTIVO | TAMAÑOS DE MERCADO | DISTRIBUCIÓN | CONSUMIDORES

¿Quién es Euromonitor International?

                                                      Nuestros servicios
                                                      Investigación sindicada
                                                      Consultoría

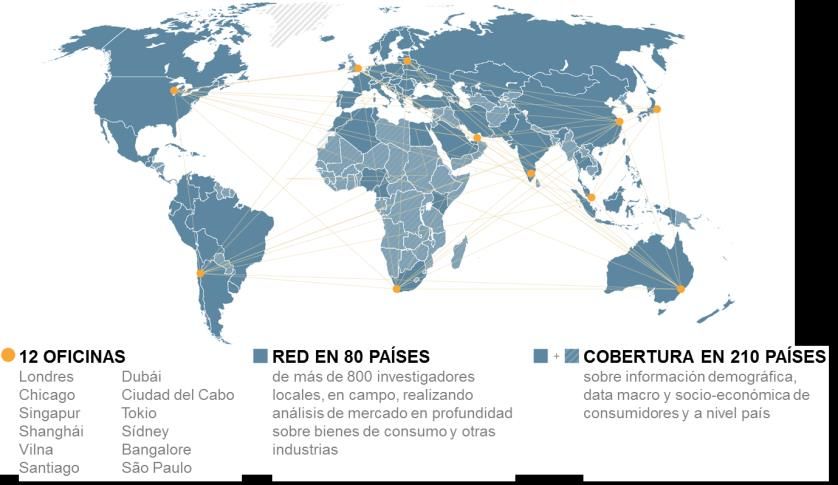
                                                      Red y cobertura amplia
                                                      Analistas en el campo en 80 países
                                                      Perspectiva completa del mercado global
                                                      Datos comparables entre los mercados

                                                      Experiencia
                                                      Tendencias de los consumidores
                                                      Empresas y marcas
                                                      Categorías de productos y canales de distribución
                                                      Producción y cadenas de valor
                                                      Economía y pronósticos de crecimiento

© Euromonitor International Ltd 2015. Applicable terms and conditions of use and the disclaimer at the front of this document apply.   3
TENDENCIAS Y PROYECCIONES DE LA INDUSTRIA DE TURISMO Y VIAJES EN AUSTRALIA, BRASIL, CHINA, COREA DEL SUR, INDIA, JAPÓN Y RUSIA - PromPerú
INTRODUCCIÓN | RESUMEN EJECUTIVO | TAMAÑOS DE MERCADO | DISTRIBUCIÓN | CONSUMIDORES

Red y cobertura de Euromonitor International

© Euromonitor International Ltd 2015. Applicable terms and conditions of use and the disclaimer at the front of this document apply.   4
TENDENCIAS Y PROYECCIONES DE LA INDUSTRIA DE TURISMO Y VIAJES EN AUSTRALIA, BRASIL, CHINA, COREA DEL SUR, INDIA, JAPÓN Y RUSIA - PromPerú
INTRODUCCIÓN | RESUMEN EJECUTIVO | TAMAÑOS DE MERCADO | DISTRIBUCIÓN | CONSUMIDORES

Client examples

Hotels                                                                                                                                 Technology

Air Transport                                                                                                              Car Rental, Cruise

© Euromonitor International Ltd 2015. Applicable terms and conditions of use and the disclaimer at the front of this document apply.            5
TENDENCIAS Y PROYECCIONES DE LA INDUSTRIA DE TURISMO Y VIAJES EN AUSTRALIA, BRASIL, CHINA, COREA DEL SUR, INDIA, JAPÓN Y RUSIA - PromPerú
INTRODUCCIÓN | RESUMEN EJECUTIVO | TAMAÑOS DE MERCADO | DISTRIBUCIÓN | CONSUMIDORES

Industria y demanda

                                                                        Viajes

                                                      Turismo
                                                                                   Turismo emisivo
                                                     receptivo

                                                                                          Perfiles del
                                                        Alojamiento
                                                                                            turista
                                                                                                                               País…
                País…
                                                         Aquiler de                        Medios de                  Como fuente de
          Como destino                                     autos                           transporte
                                                                                                                       la demanda

                                                        Actividades                     Intermediarios

                                                                                         Venta online

© Euromonitor International Ltd 2015. Applicable terms and conditions of use and the disclaimer at the front of this document apply.   6
TENDENCIAS Y PROYECCIONES DE LA INDUSTRIA DE TURISMO Y VIAJES EN AUSTRALIA, BRASIL, CHINA, COREA DEL SUR, INDIA, JAPÓN Y RUSIA - PromPerú
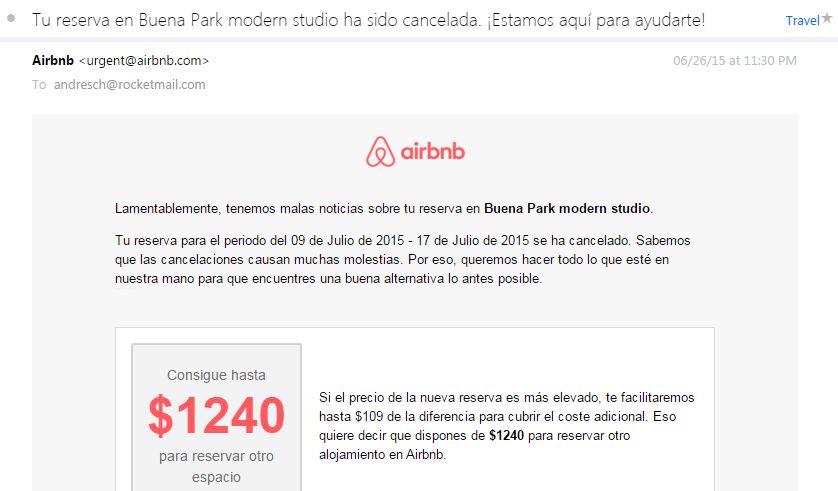
INTRODUCCIÓN | RESUMEN EJECUTIVO | TAMAÑOS DE MERCADO | DISTRIBUCIÓN | CONSUMIDORES

Metodología de investigación de Euromonitor International

© Euromonitor International Ltd 2015. Applicable terms and conditions of use and the disclaimer at the front of this document apply.   7
TENDENCIAS Y PROYECCIONES DE LA INDUSTRIA DE TURISMO Y VIAJES EN AUSTRALIA, BRASIL, CHINA, COREA DEL SUR, INDIA, JAPÓN Y RUSIA - PromPerú
INTRODUCCIÓN | RESUMEN EJECUTIVO | TAMAÑOS DE MERCADO | DISTRIBUCIÓN | CONSUMIDORES

 Objetivos del Seminario
Categorías cubiertas                               Brindar información especializada y relevante de actores
                                                    clave de la industria del turismo.
  Viaje

Países cubiertos                                   Presentar análisis de las tendencias y proyecciones de la
                                                    industria de turismo y viajes de Brasil, Australia, China,
  Brasil                                           Corea del Sur, India, Japón y Rusia.
  Australia
  Corea del Sur                                   Presentar análisis de las características de estos
  India                                            mercados, así como las tendencias del consumidor, entre
  Japón                                            otras variables significativas.
  Rusia
  China                                           Servir de fuente de informaciones para la toma de
                                                    decisiones por parte de las empresas de turismo
                                                    participantes y profesionales de Promperú Turismo.

 © Euromonitor International Ltd 2015. Applicable terms and conditions of use and the disclaimer at the front of this document apply.   8
INTRODUCCIÓN | RESUMEN EJECUTIVO | TAMAÑOS DE MERCADO | DISTRIBUCIÓN | CONSUMIDORES

Definiciones

       Categoría                                                                           Definición
                                       Viaje es una industria que abarca mercados tan diversos como el
                                       transporte (aerolíneas, ferrocarriles y compañías de ferry),
             Viaje                     minoristas de viaje, alojamiento, atracciones turísticas, turismo de
                                       salud y bienestar y alquiler de autos, así como los flujos de turismo
                                       estándar y gastos por turismo.

                                       Se refiere a las empresas proveedoras de servicio turístico que
Distribución Directa
                                       interactúan directamente con el cliente final.

                                       Incluye a las agencias de viajes y operadores de turismo que actúan
     Intermediarios                    como representantes de los proveedores, facilitando toda la
                                       información sobre los servicios que se ofrecen.

© Euromonitor International Ltd 2015. Applicable terms and conditions of use and the disclaimer at the front of this document apply.   9
INTRODUCCIÓN
RESUMEN EJECUTIVO
TAMAÑOS DE MERCADO
DISTRIBUCIÓN
CONSUMIDORES
PREGUNTAS
INTRODUCCIÓN | RESUMEN EJECUTIVO | TAMAÑOS DE MERCADO | DISTRIBUCIÓN | CONSUMIDORES

     Para Japón y Corea del Sur Perú es el tercer país
     latinoamericano más visitado en 2014
                                                                                                                                            Japón
                                                                                                                                            1    EE.UU.
                                                                                                                                                          17.1%
                                                                                                                                            31 México

China                                                                                                                                       35 Brasil
1  Hong Kong
                                                                                                                                            39 Perú
          29.6%
41 México

46 Brasil                                                                                                                   Corea del Sur
                                                                                                                             1    China
84 Perú
                                                                                                                                                20.6%
                                                                                                                             40 Brasil
               India
          1                                                                                                                  43 México
                 Arabia Saudita
                         14.0%
          53     Brasil                                                                                                      64 Perú

          54     México

          91     Perú

     © Euromonitor International Ltd 2015. Applicable terms and conditions of use and the disclaimer at the front of this document apply.                    11
INTRODUCCIÓN | RESUMEN EJECUTIVO | TAMAÑOS DE MERCADO | DISTRIBUCIÓN | CONSUMIDORES

Perú es el cuarto destino latinoamericano para australianos en
2014

                          Rusia
                            1       Turquía
                                          13.0%
                            39      Republica
                                    Dominicana

                            54      Cuba

                            90      Perú

                                                                                        Australia
                                                                                         1      EE.UU.
                                                                                                     7.7%
                                                   Brasil                                42     Argentina
                                                   1     EE.UU.
                                                                                         45     Chile
                                                               23.3%
                                                   2     Argentina
                                                                                         50     Perú
                                                   6     Chile

                                                   12 Perú

© Euromonitor International Ltd 2015. Applicable terms and conditions of use and the disclaimer at the front of this document apply.   12
INTRODUCCIÓN | RESUMEN EJECUTIVO | TAMAÑOS DE MERCADO | DISTRIBUCIÓN | CONSUMIDORES

Principales factores que impactan el mercado de viajes

                                                TAMAÑOS DE MERCADO
                                                  Demanda Potencial

              1
                      La situación económica de algunos países está limitando las
                                               salidas

              2
                          Seguridad, virus Zika, falta de conectividad y distancias
                                  afectan viajes a Perú y Latinoamérica

© Euromonitor International Ltd 2015. Applicable terms and conditions of use and the disclaimer at the front of this document apply.   13
INTRODUCCIÓN | RESUMEN EJECUTIVO | TAMAÑOS DE MERCADO | DISTRIBUCIÓN | CONSUMIDORES

Principales factores que impactan el mercado de viajes

                                                         DISTRIBUCIÓN
                                                        Proceso de Ventas

              3
                                    Rápido crecimiento de la venta móvil y online

              4
                                      Fuerte penetración de economía compartida
                                                   (ej: Uber y Airbnb)

© Euromonitor International Ltd 2015. Applicable terms and conditions of use and the disclaimer at the front of this document apply.   14
Economía compartida: interacción entre dos o más sujetos, a través de medios digitalizados o no, que satisface una necesidad real o
potencial, a una o más personas. Por ejemplo, Uber y Airbnb.
INTRODUCCIÓN | RESUMEN EJECUTIVO | TAMAÑOS DE MERCADO | DISTRIBUCIÓN | CONSUMIDORES

Principales factores que impactan el mercado de viajes

                                                          CONSUMIDORES

              5
                        Salidas desde China, India y Corea del Sur impulsadas por
                                         consumidores jóvenes

              6
                        Los consumidores mayores empujan el crecimiento de las
                                 salidas desde Australia, Japón y Rusia

             7
                    Los viajes de ocio continúan dominando las salidas por sobre
                                         los viajes de negocio

© Euromonitor International Ltd 2015. Applicable terms and conditions of use and the disclaimer at the front of this document apply.   15
INTRODUCCIÓN
RESUMEN EJECUTIVO
TAMAÑOS DE MERCADO
DISTRIBUCIÓN
CONSUMIDORES
PREGUNTAS
INTRODUCCIÓN | RESUMEN EJECUTIVO | TAMAÑOS DE MERCADO | DISTRIBUCIÓN | CONSUMIDORES

China presenta el mercado más grande y con niveles de gasto
por viaje dentro de los más altos
                                              Número total y gastos viajes de salida por país: 2014
                           70.000                                                                                                         180.000
                                    164.900
                                               Gasto por                                                                                  160.000
                           60.000                viaje:
                                               US$2,603
                                                                                                                                          140.000

                           50.000
                                               Gasto por                                                                                  120.000
 Número de Viajes (‘000)

                                                                                                                                                    Valor Retail (US$ mn)
                                                 viaje:
                           40.000              US$1,442
                                                                                                                                          100.000
                                                             Gasto por
                                                               viaje:                Gasto por
                                                                                       viaje:           Gasto por                         80.000
                           30.000                            US$1,165
                                                                                     US$1,416             viaje:
                                                                                                        US$1,366            Gasto por
                                              50.400                                                                          viaje:      60.000
                           20.000                                                                                           US$1,690
                                                                                                                                          40.000
                                                           26.300           25.600            23.500
                           10.000                                                                              19.300
                                                                                                                                15.800    20.000

                                    63.345    34.960       22.566           19.226            16.597           14.125            9.351
                               0                                                                                                          0
                                    China     Rusia        Japón        Corea del Sur       Australia           India            Brasil

© Euromonitor International Ltd 2015. Applicable terms and conditions of use and the disclaimer at the front of this document apply.                                  17
INTRODUCCIÓN | RESUMEN EJECUTIVO | TAMAÑOS DE MERCADO | DISTRIBUCIÓN | CONSUMIDORES

En China e India las salidas crecen alrededor de un 10% en
2014 debido al aumento de los ingresos disponibles

                                           CHINA
                                           • Las salidas crecieron un 10% en 2014, sostenidas por
                                             el crecimiento de la economía, que aumentó los ingresos
                                             disponibles para gastos de viajes.
                                           • China, seguida por el EUA y Rusia, presentó el mayor
                                             crecimiento en términos absolutos del número de salidas
                                             entre 2009 y 2014 (36 millones de salidas).

                                           INDIA
                                           • Las salidas crecieron un 9% en 2014, impulsadas por
                                             una mayor base de consumidores urbanos con ingresos
                                             disponibles que empezaron viajar con mayor frecuencia.
                                             Esta tendencia se mantuvo durante el 2015.

                                           COREA DEL SUR
                                           • Las salidas aumentaron un 8% en 2014. La mayor
                                             disponibilidad de aerolíneas de bajo costo y la exposición
                                             a destinos extranjeros a través de los medios y las redes
                                             sociales son factores que contribuyeron al crecimiento.
© Euromonitor International Ltd 2015. Applicable terms and conditions of use and the disclaimer at the front of this document apply.   18
INTRODUCCIÓN | RESUMEN EJECUTIVO | TAMAÑOS DE MERCADO | DISTRIBUCIÓN | CONSUMIDORES

Factores económicos en Rusia están afectando el turismo
emisor desde este país

                                            RUSIA
                                            • En 2014, debido a la crisis económica y la caída del
                                              rublo, los ingresos disponibles de los rusos se
                                              redujeron. Debido al aumento de los costos de los viajes
                                              al extranjero, las salidas se redujeron un 17%,
                                              tendencia que durante el 2015 se agudizó por la
                                              situación política y económica del país.
                                            • Antes de la crisis económica, durante el período 2009-
                                              2014, Rusia tuvo el tercer lugar en crecimiento absoluto
                                              alcanzando 12 millones de salidas.

                                            BRASIL
                                            • Las salidas crecieron un 4% y alcanzaron 9,4 millones
                                              de viajes en 2014. En 2015, el crecimiento desaceleró
                                              en comparación al año anterior debido a la
                                              incertidumbre económica del país.

© Euromonitor International Ltd 2015. Applicable terms and conditions of use and the disclaimer at the front of this document apply.   19
INTRODUCCIÓN | RESUMEN EJECUTIVO | TAMAÑOS DE MERCADO | DISTRIBUCIÓN | CONSUMIDORES

El contexto económico de Australia y Japón están
desacelerando las salidas desde estos países

                                             AUSTRALIA
                                             • En 2014, el número de viajes al exterior aumentó un
                                               3%, desacelerando en comparación al 5.3% de
                                               crecimiento registrado en 2013. Esto se debe
                                               principalmente a la depreciación del dólar australiano
                                               que encareció los viajes.

                                             JAPÓN
                                             • Las salidas desde Japón se desaceleraron en 2014,
                                               alcanzando un 1.3% de crecimiento (en 2013 alcanzó
                                               un 2.4%), debido al debilitamiento del yen, que
                                               encareció los viajes al exterior.

© Euromonitor International Ltd 2015. Applicable terms and conditions of use and the disclaimer at the front of this document apply.   20
INTRODUCCIÓN | RESUMEN EJECUTIVO | TAMAÑOS DE MERCADO | DISTRIBUCIÓN | CONSUMIDORES

Brasil es el único país donde las salidas a Perú representan más
del 1% de su turismo emisor
                                                                Turismo emisor (2014)
                                              América                          Latinoamérica                                       Perú

                   Salidas
     País        totales (en                                                                                 Total                        Ranking de los
                                   Total (en      % del total de        Total (en      % del total de                     % del total
                   miles)                                                                                     (en                            países
                                    miles)           salidas             miles)           salidas                         de salidas
                                                                                                             miles)                        receptores*

 Australia         16,596.8          1,945              12%               388.9              2.3%              36.8           0.2%           50/204

 Brasil             9,350.9          5,117              55%              2,845.1            30.4%             143.7           1.5%           12/203

 China             63,344.5          2,786               4%               379.5              0.6%              13.7          0.02%           85/206

 Corea del
                   19,225.8          1,800               9%               172.0              0.9%              14.4           0.1%           61/200
 Sur

 India             14,124.8          1,236               9%               122.2              0.9%              4.7           0.03%           90/194

 Japón             22,565.7          4,490              20%               416.5              1.8%              66.2           0.3%           40/206

 Rusia             34,960.3           795                2%               416.6              1.2%              8.9           0.03%           89/207

 Los viajes a Latinoamérica y a Perú son limitados para la mayoría de los países, principalmente por
 la gran distancia que existe.
© Euromonitor International Ltd 2015. Applicable terms and conditions of use and the disclaimer at the front of this document apply.                  21

*Ranking de los países receptores: se refiere al lugar que ocupa Perú dentro de las países receptores
INTRODUCCIÓN | RESUMEN EJECUTIVO | TAMAÑOS DE MERCADO | DISTRIBUCIÓN | CONSUMIDORES

Latinoamérica sigue aumentando su presencia como destino
turístico
                                                                Viajes a Latinoamérica por país: 2014-2019
                          3.500                                                                                                                 8%
                                          3.185

                          3.000   2.845                                                                                                7%       7%

                                                                                                                                                     2014-2019 TCAC
                                                                                                       6%                                       6%
                          2.500
Número de viajes (‘000)

                                                                                                                                                5%
                          2.000                                                                                        4%
                                                                                                                                                4%
                                                                                         4%
                          1.500
                                                                                                                                                3%
                          1.000      2%                                2%                                                                       2%
                                                        2%           417    464           470                506
                           500                    417        449                    389              380
                                                                                                                          214                   1%
                                                                                                                    172            122    171

                             0                                                                                                                  0%
                                    Brasil              Rusia         Japón         Australia         China        Corea del Sur       India

                                                                           2014   2019        2014-19 TCAC

                   Campañas mundiales de marketing, la recuperación económica en los mercados de
                  origen y la rápida mejora de la infraestructura turística serán los motivos que generen
                                      un crecimiento constante del turismo receptivo.
© Euromonitor International Ltd 2015. Applicable terms and conditions of use and the disclaimer at the front of this document apply.                 22
INTRODUCCIÓN | RESUMEN EJECUTIVO | TAMAÑOS DE MERCADO | DISTRIBUCIÓN | CONSUMIDORES

Se espera sigan aumentando los viajes hacia Perú desde todos
los países, con un TCAC 2014-19 consolidado de 3.8%
                                                        Viajes a Perú por país: 2014-2019
                          180         169                                                                                                          9%

                          160                                                                                                          8%          8%
                                144

                                                                                                                                                        2014-2019 TCAC
                                                                                               7%
                          140                                                                                                                      7%

                          120                                                                                                                      6%
Número de viajes (‘000)

                                                                            5%
                          100                                                                                                                      5%
                                                          5%
                                                 77
                           80                                                                                                                      4%
                                            66
                                  3%
                           60                3%                                                                                                    3%
                                                               46
                                                                                                                    3%
                                                        37
                           40                                                                                                                      2%
                                                                                 19                20
                           20                                              14               14                                                     1%
                                                                                                                9     10                       7
                                                                                                                                   5
                            0                                                                                                                      0%
                                 Brasil      Japón      Australia      Corea del sur          China              Rusia                 India

                                                             2014   2019    2014-19 TCAC

                          Se espera que los viajes a Perú aumenten más rápido que los viajes totales desde
                                  estos países, ya que Perú aún es considerado un destino nuevo.
© Euromonitor International Ltd 2015. Applicable terms and conditions of use and the disclaimer at the front of this document apply.                    23
INTRODUCCIÓN | RESUMEN EJECUTIVO | TAMAÑOS DE MERCADO | DISTRIBUCIÓN | CONSUMIDORES

En China e India se espera un crecimiento significativo de los
viajes al extranjero al aumentar los ingresos disponibles

6.3% TCAC 2014-19                                                                7.2% TCAC 2009-14

                                  China                                                                               India

                                          4.1% TCAC 2014-19

                                                                  Corea del Sur

© Euromonitor International Ltd 2015. Applicable terms and conditions of use and the disclaimer at the front of this document apply.   24
INTRODUCCIÓN | RESUMEN EJECUTIVO | TAMAÑOS DE MERCADO | DISTRIBUCIÓN | CONSUMIDORES

Japón y Australia son mercados más maduros para el mercado
de viajes pero continuarán creciendo a tasas significativas

1.8% TCAC 2014-19                                                                  3.9% TCAC 2014-19

                                  Japón                                                                           Australia

0.1% TCAC 2014-19                                                               2.1% TCAC 2014-19

                                Rusia                                                                                 Brasil

© Euromonitor International Ltd 2015. Applicable terms and conditions of use and the disclaimer at the front of this document apply.   25
INTRODUCCIÓN | RESUMEN EJECUTIVO | TAMAÑOS DE MERCADO | DISTRIBUCIÓN | CONSUMIDORES

Latinoamérica podría experimentar una rápida expansión del
virus del Zika
                                                                                                                    Países de Latinoamérica
                                                                                                                    con transmisión activa del
                                                                                                                          virus del Zika.

     El virus Zika ya ha impactado en
     alguna medida al mercado de viajes
     Los vuelos a las zonas afectadas
     habían caído un 3.4% al 19 de febrero
     del 2016, desde que el CDC emitió su
     advertencia el 15 de enero del 2016.

                                             Nota: actualizada al 5 de febrero de 2016.
                                             Incluye las transmisiones locales, pero no las
                                             importadas de viajes.
                                             Fuente: Centro para el Control y la Prevención
                                             de Enfermedades de los EE. UU (CDC).

© Euromonitor International Ltd 2015. Applicable terms and conditions of use and the disclaimer at the front of this document apply.      26
INTRODUCCIÓN | RESUMEN EJECUTIVO | TAMAÑOS DE MERCADO | DISTRIBUCIÓN | CONSUMIDORES

                             El virus Zika podría provocar la disminución de las salidas a
                             Latinoamérica, tal como la gripe aviar impactó en las salidas a Asia
                           Para tener una idea de los efectos de esta enfermedad en el turismo, podemos mirar lo
                           que ocurrió con casos de brotes comparables en Asia Pacífico

                                                            Crecimientos en flujos de viaje para Asia Pacífico: 2001-2006
                                        35

                                        30       Síndrome respiratorio
                                               agudo severo (SARS) y la
Viajes (crecimiento año a año %)

                                        25
                                                  gripe aviar (H5N1)
                                        20
                                               Disminución viajes a Asia
                                                    Pacífico: 8.7%
                                        15

                                        10

                                         5

                                         0
                                                     2001-02                    2002-03                     2003-04                    2004-05                      2005-06
                                        -5

                                       -10

                                       -15

                                                                  Doméstico                                  Salidas                                Llegadas

                             © Euromonitor International Ltd 2015. Applicable terms and conditions of use and the disclaimer at the front of this document apply.             27
INTRODUCCIÓN
RESUMEN EJECUTIVO
TAMAÑOS DE MERCADO
DISTRIBUCIÓN
CONSUMIDORES
PREGUNTAS
INTRODUCCIÓN | RESUMEN EJECUTIVO | TAMAÑOS DE MERCADO | DISTRIBUCIÓN | CONSUMIDORES

En general, la oferta de servicios turísticos se puede dividir en
dos grandes canales: distribución directa e intermediarios

                                                                                                    Intermediarios
              Distribución Directa                                                              Agencias de viajes y
                                                                                            operadores de turismo que
             Empresa proveedora del
                                                                                          actúan como representantes de
            servicio turístico interactúa
                                                                                         los proveedores, facilitando toda
         directamente con el cliente final
                                                                                              la información sobre los
                                                                                              servicios que se ofrecen

© Euromonitor International Ltd 2015. Applicable terms and conditions of use and the disclaimer at the front of this document apply.   29
INTRODUCCIÓN | RESUMEN EJECUTIVO | TAMAÑOS DE MERCADO | DISTRIBUCIÓN | CONSUMIDORES

Corea del Sur y Australia son los mercados más concentrados
con más del 25% en las manos de un intermediario
                                Principales intermediarios (valor total de ventas, % de participación)
     Australia              Brasil            China              India            Japón            Rusia                                Corea del Sur
                                                            Indian Railway
   Flight Centre                       China International    Catering &
   Travel Group            Viagens        Travel Service       Tourism          JTB Corp        Biblio Travel                          Hanatour Service
                           $2,086.0                                             $14,303.3         $1,708.3
$ 7,819.1 (26.7%)                       $7,262.3 (16.2%) $2,761.4 (11.5%)                                                              $2,135.0 (27.6%)
                           (12.2%)                                               (19.4%)           (7.6%)
                                            Shanghai Chunqiu
    Helloworld   Flytour. Grupo              Tourism Service MakeMyTrip India KNT-CT Holdings PEGAS Touristik InterPark INT
                    $1,772.8                                    $1,352.3         $4,964.0        $971.1
$4,952.2 (16.9%)                            $5,587.0 (12.5%)                                                 $1,141.5 (14.8%)
                    (10.4%)                                      (5.6%)           (6.7%)         (4.3%)
Carlson Wagonlit                                 Ctrip.com                                   Nippon Travel                                Modetour
Travel Australia         Decolar.com           International           Yatra Online             Agency                Tez Tour            Network
    $1,713.0               $999.8                                       $1,057.0               $4,044.0                $830.4             $1,145.3
                                            $5,247.0 (11.7%)
     (5.9%)                (5.8%)                                        (4.4%)                 (5.5%)                 (3.7%)             (14.8%)
                                              China Kanghui          Cleartrip Travel
     Expedia             CWT Brasil          Tourism Service            Services                 HIS Co             Natalie Tours        Lotte Group
     $1,506.5             $718.6                                         $621.1                 $4,036.2               $828.0              $505.0
                                             $2,521.7 (5.6%)
      (5.2%)              (4.2%)                                         (2.6%)                  (5.5%)                (3.7%)              (6.5%)
                      TVLX Viagens e China CYTS Tours                                                                                  Freedom Travel
 Priceline Group         Turismo          Holding                      Ibibo Group          Rakuten Travel          Intourist VAO         Services
     $913.0              $473.4          $2,391.9                         $453.7              $3,608.7                  $820.8             $274.1
     (3.1%)               (2.8%)          (5.3%)                          (1.9%)               (4.9%)                   (3.6%)             (3.5%)
       Otras                Otras                   Otras                  Otras                 Otras                  Otras               Otras
     $12,347.0            $11,057.9                                      $17,690.3             $42,657.9              $17,381.1
                                            $21,842.0 (48.7%)                                                                          $2,521.6 (32.8%)
      (42.2%)              (64.6%)                                        (74.0%)               (58.0%)                (77.1%)

© Euromonitor International Ltd 2015. Applicable terms and conditions of use and the disclaimer at the front of this document apply.                   30
INTRODUCCIÓN | RESUMEN EJECUTIVO | TAMAÑOS DE MERCADO | DISTRIBUCIÓN | CONSUMIDORES

Australia y Brasil lideran la compra directa para transporte aéreo

                                               Transporte aéreo: distribución directa versus intermediarios (2014)
                                  100%

                                  90%     20%
                                                        29%
                                  80%
                                                                                                    50%                47%
                                  70%                               62%
 % del total valor distribución

                                                                                    67%
                                  60%                                                                                                     76%

                                  50%

                                  40%     80%
                                                        71%
                                  30%
                                                                                                    50%                53%
                                  20%                               38%
                                                                                    33%
                                  10%                                                                                                     24%

                                   0%
                                         Australia      Brasil      China           India           Japón               Rusia          Corea del Sur
                                                                               Transporte Aéreo

                                                                     Directa       Intermediarios

© Euromonitor International Ltd 2015. Applicable terms and conditions of use and the disclaimer at the front of this document apply.                   31
INTRODUCCIÓN | RESUMEN EJECUTIVO | TAMAÑOS DE MERCADO | DISTRIBUCIÓN | CONSUMIDORES

En China, Rusia y Australia los alojamientos se compran a
través de canales de distribución directa
                                                     Alojamiento: distribución directa versus intermediarios (2014)
                                  100%

                                  90%
                                          34%                           30%                                            34%
                                  80%
                                                                                     51%              50%                                 53%
                                  70%
 % del total valor distribución

                                                           71%
                                  60%

                                  50%

                                  40%
                                          66%                           70%                                            66%
                                  30%
                                                                                     49%              50%                                 47%
                                  20%
                                                           29%
                                  10%

                                   0%
                                         Australia         Brasil       China         India           Japón             Rusia          Corea del Sur
                                                                                   Alojamiento

                                                                         Directa     Intermediarios

© Euromonitor International Ltd 2015. Applicable terms and conditions of use and the disclaimer at the front of this document apply.                   32
INTRODUCCIÓN | RESUMEN EJECUTIVO | TAMAÑOS DE MERCADO | DISTRIBUCIÓN | CONSUMIDORES

La distribución directa predomina en el alquiler de autos para
todos los países, con excepción de Brasil
                                                Alquiler de auto: distribución directa versus intermediarios (2014)
                                  100%
                                                                                      8%                                                   8%
                                  90%
                                          25%                                                                          25%
                                                                     33%
                                  80%                                                                 39%

                                  70%
 % del total valor distribución

                                  60%

                                  50%                   99%
                                                                                     92%                                                  92%
                                  40%
                                          75%                                                                          75%
                                                                     67%
                                  30%                                                                 61%

                                  20%

                                  10%

                                   0%                    1%
                                         Australia       Brasil      China            India           Japón             Rusia          Corea del Sur
                                                                                 Alquiler de Auto

                                                                       Directa       Intermediarios

© Euromonitor International Ltd 2015. Applicable terms and conditions of use and the disclaimer at the front of this document apply.                   33
INTRODUCCIÓN | RESUMEN EJECUTIVO | TAMAÑOS DE MERCADO | DISTRIBUCIÓN | CONSUMIDORES

Sólo en Australia y Japón la compra de pasajes aéreos se
realiza principalmente online
                                             Transporte Aéreo: distribución online versus offline (2014)
                          100%

                          90%
                                                                23%
(%) del total del valor

                                                                                                                       26%
                          80%                    40%                                                                                      39%
                                                                                48%
                          70%                                                                      58%

                          60%     76%

                          50%

                          40%
                                                                77%                                                    74%
                          30%                    60%                                                                                      61%
                                                                                52%
                          20%                                                                      42%

                          10%     24%

                           0%
                                 Australia       Brasil             China       India              Japón               Rusia           Corea del Sur

                                                          Offline                                      Online

© Euromonitor International Ltd 2015. Applicable terms and conditions of use and the disclaimer at the front of this document apply.                   34
INTRODUCCIÓN | RESUMEN EJECUTIVO | TAMAÑOS DE MERCADO | DISTRIBUCIÓN | CONSUMIDORES

India y Corea del Sur se encuentran atrasados en las compras
online de alojamiento alcanzando sólo un 8% de las ventas
                                             Alojamientos: distribución online versus offline (2014)
                          100%
                                                               12%              8%                                                         8%
                                                                                                                       14%
                          90%
                                                23%
(%) del total del valor

                          80%                                                                      37%

                          70%     60%

                          60%

                          50%
                                                               88%              92%                                                       92%
                                                                                                                       86%
                          40%
                                                77%
                          30%                                                                      63%

                          20%     40%

                          10%

                           0%
                                 Australia      Brasil             China        India              Japón               Rusia           Corea del Sur

                                                         Offline                                       Online

© Euromonitor International Ltd 2015. Applicable terms and conditions of use and the disclaimer at the front of this document apply.                   35
INTRODUCCIÓN | RESUMEN EJECUTIVO | TAMAÑOS DE MERCADO | DISTRIBUCIÓN | CONSUMIDORES

La venta online de alquiler de autos y alojamiento está menos
desarrollada que el transporte aéreo
                                             Alquiler de autos: distribución online versus offline (2014)
                          100%
                                                7%
                          90%                                  18%              15%
(%) del total del valor

                                                                                                                       28%                32%
                          80%                                                                      37%

                          70%
                                  66%
                          60%

                          50%
                                                93%
                          40%                                      82%          85%
                                                                                                                       72%                68%
                          30%                                                                       63%

                          20%
                                  34%
                          10%

                           0%
                                 Australia      Brasil             China        India              Japón               Rusia           Corea del Sur

                                                         Offline                                       Online

© Euromonitor International Ltd 2015. Applicable terms and conditions of use and the disclaimer at the front of this document apply.                   36
INTRODUCCIÓN | RESUMEN EJECUTIVO | TAMAÑOS DE MERCADO | DISTRIBUCIÓN | CONSUMIDORES

Aerolíneas directas y agencias online ocupan un lugar
importante en las compras por dispositivos móviles
                                                           Ventas por dispositivos móviles: 2014
                          100%
                                     1%           2%                            6%
                                                                  8%                                                                      10%
                                                                                                                       14%
                          90%
(%) del total del valor

                                                  22%
                          80%       34%                                                            38%                  7%

                          70%                     10%                           51%                                    22%                49%
                          60%       11%                          67%
                          50%
                                    3%
                                    2%
                          40%                                                                      41%
                                                                                                                                          10%
                          30%                     64%                                                                                     2%
                                                                                                                       57%
                                    48%
                          20%                                    10%            41%                                                       17%
                                                                                                    5%
                                                                  4%                                1%
                          10%
                                                                 11%                               14%                                    12%
                           0%
                                   Australia      Brasil         China          India              Japón               Rusia           Corea del Sur

                                 Aerolíneas Directa                 Otros Transportes Directo                   Alquiler de Auto Directo
                                 Alojamiento Directo                Agencias Online                             Operadores

© Euromonitor International Ltd 2015. Applicable terms and conditions of use and the disclaimer at the front of this document apply.                   37
INTRODUCCIÓN | RESUMEN EJECUTIVO | TAMAÑOS DE MERCADO | DISTRIBUCIÓN | CONSUMIDORES

Intermediarios en Australia y Brasil se ven afectados por cambios
de preferencia e inestabilidad económica, respectivamente

• El uso de intermediarios, sobre todo                                             • La inestabilidad política y
  de operadores, disminuyó en 2014, a                                                económica también afectó
  medida que los australianos prefirieron                                            negativamente las ventas de
  los destinos internos.                                                             intermediarios.
                                                                                   • Falta de confianza obstaculizadas
                                                                                     ventas online.
                               Australia                                                                            Brasil

• Las ventas online y dispositivos                                                 • Las ventas online mediante
  móviles son claves para el crecimiento                                             intermediarios están registrando un
  de los intermediarios, gracias a la                                                importante crecimiento, impulsado por
  comodidad y los precios competitivos.                                              un mayor uso de la tecnología en los
                                                                                     sectores urbanos y rurales de la India.

                                  China                                                                             India

© Euromonitor International Ltd 2015. Applicable terms and conditions of use and the disclaimer at the front of this document apply.   38
INTRODUCCIÓN | RESUMEN EJECUTIVO | TAMAÑOS DE MERCADO | DISTRIBUCIÓN | CONSUMIDORES

Tanto los distribuidores directos como los intermediarios se
pueden ver beneficiados de expansión del canal online

• Los proveedores directos están                                                   • En 2014, las quiebras de distintos
  mejorando sus portales online para                                                 intermediarios dejaron varados a
  vender directamente a los consumidores                                             muchos turistas, lo que condujo a una
  y maximizar los ingresos.                                                          falta de confianza entre los
                                                                                     consumidores.

                                  Japón                                                                             Rusia

                                          • Los intermediarios no sólo se
                                            beneficiaron del rápido crecimiento
                                            del turismo emisor y receptor en
                                            2014, sino también de la evolución de
                                            las reservas online.

                                                                  Corea del Sur

© Euromonitor International Ltd 2015. Applicable terms and conditions of use and the disclaimer at the front of this document apply.   39
INTRODUCCIÓN | RESUMEN EJECUTIVO | TAMAÑOS DE MERCADO | DISTRIBUCIÓN | CONSUMIDORES

    Las agencias de viaje tradicionales: necesitan adaptarse

•       El consumidor cada vez más se maneja por sí mismo en sitios de aerolíneas,
        de agencias online (Despegar, Atrapalo), en sitios como Booking.com, Airbnb,
        etc.

•       Oportunidades para agencias tradicionales:

          •      Segmento negocios

          •      Tours de grupos y nichos de mercado (aventura, salud, gastronómico,
                 etc.)

          •      Paquetes personalizados. En agencias online y sitios de aerolíneas están
                 más estandarizados.

    © Euromonitor International Ltd 2015. Applicable terms and conditions of use and the disclaimer at the front of this document apply.   40
INTRODUCCIÓN | RESUMEN EJECUTIVO | TAMAÑOS DE MERCADO | DISTRIBUCIÓN | CONSUMIDORES

    Las agencias de viaje online: crecen más que las tradicionales

•       Vuelos representan 50% de su facturación

•       Los más relevantes son los vuelos internacionales

          •      Ventaja sobre agencias tradicionales y aerolíneas son los motores de
                 búsqueda que encuentran el mejor precio

    © Euromonitor International Ltd 2015. Applicable terms and conditions of use and the disclaimer at the front of this document apply.   41
INTRODUCCIÓN | RESUMEN EJECUTIVO | TAMAÑOS DE MERCADO | DISTRIBUCIÓN | CONSUMIDORES

    Móviles: aún se usa más para buscar que para comprar

•       40% de las búsquedas pero solo 10-15% de las compras (objetivo es 40% en
        un par de años)

•       Razones:

          •      Mayor tranquilidad en el hogar, donde antes de la decisión final el cliente
                 desea mirar fotos, recomendaciones, etc.

          •      Mayor tranquilidad para poner tarjeta en el computador

    © Euromonitor International Ltd 2015. Applicable terms and conditions of use and the disclaimer at the front of this document apply.   42
INTRODUCCIÓN | RESUMEN EJECUTIVO | TAMAÑOS DE MERCADO | DISTRIBUCIÓN | CONSUMIDORES

Australia, Corea del Sur, Brasil y Japón presentan alta concentración
de las aerolíneas con +60% del mercado en sólo dos empresas
                                       Principales aerolíneas (millones de USD, % de participación)
       Australia                Brasil           China             India         Japón              Rusia                                Corea del Sur
                            TAM Linhas                                                        All Nippon    Aeroflot Russian
   Qantas Airways              Aéreas             Air China Co             Air India        Airways (ANA) International Airlines Korean Air Lines
     $11,972.5                $5,499.6             $14,320.5               $2,586.0           $10,782.5         $4,065.4            $3,202.3
      (51.1%)                 (40.5%)                (26.0%)               (13.8%)             (33.6%)          (24.8%)              (43.0%)
                            GOL Linhas
    Virgin Australia           Aéreas            China Southern          Jet Airways         Japan Airline
       Holdings             Inteligentes             Airlines               India             Corp (JAL)            Transaero AK         Asiana Airlines
       $3,719.3               $4,192.0             $12,844.9              $1,685.7             $9,008.6               $2,374.2              $1,620.5
        (15.8%)               (30.9%)               (23.3%)                (9.0%)              (28.1%)                 (14.5%)              (19.5%)
                            Azul Linhas
                               Aéreas             China Eastern          InterGlobe
  Emirates Group             Brasileiras             Airlines            Enterprises       Skymark Airlines          Sibir Avialinii        Cebu Air
       $1,223.8               $2,722.4              $8,605.8              $1,393.1             $807.7                  $1,620.7               $51.6
         (5.2%)               (20.1%)                (15.6%)               (7.4%)              (2.5%)                   (9.9%)               (0.6%)
      Singapore
  Airlines Ltd (SIA)       Avianca-Taca          Hainan Airlines          SpiceJet          Peach Aviation Utair Aviakompaniya              AirAsia
       $1,108.3               $812.0                $4,709.1               $967.8               $302.5           $1,177.1                    $50.3
         (4.7%)               (6.0%)                 (8.5%)                (5.2%)               (0.9%)             (7.2%)                   (0.6%)
  Malaysian Airline                                                      Go Airlines                              Rossiya
        System                     -             Xiamen Airlines           (India)          JetStar Japan    Aviakompaniya                      -
         $785.5                                     $3,052.5               $195.0               $287.0             $711.4
                                   -                                                                                                            -
         (3.3%)                                      (5.5%)                (1.0%)               (0.9%)             (4.3%)
          Otras                 Otras                 Otras                 Otras                Otras              Otras                    Otras
       $4,673.1                $341.8               11,631.0             $11,879.4            $10,928.4          $6,462.6                   $3,395.5
        (19.9%)                (2.5%)               (21.1%)               (63.6%)              (34.0%)            (39.3%)                   (40.8%)
      Opera vuelos directos a Perú
  © Euromonitor International Ltd 2015. Applicable terms and conditions of use and the disclaimer at the front of this document apply.                 43
INTRODUCCIÓN | RESUMEN EJECUTIVO | TAMAÑOS DE MERCADO | DISTRIBUCIÓN | CONSUMIDORES

    El modelo low cost avanza
•       Sky Airline migró al modelo low cost y lo va a profundizar. Esto facilita viajes
        entre países y ciudades dentro de la región.

•       En septiembre 2015 quitaron alimentos y bebidas gratuitos. Desde enero
        2016 los cobran. Tuvo impacto en satisfacción cliente pero tambiénn en
        ingresos.

•       Próximamente cobrarán también las maletas despachadas y elección de
        asientos.

•       Baja en costos y en precio del petróleo les permitió bajar tarifas en un 40% en
        2015. LAN debió adaptarse y también bajó. El plan es bajar aún más los
        precios en 2016. La baja de precios les permitió aumentar la tasa de
        ocupación.

•       La baja de precio no implica baja de calidad. Para demostrarlo se certificaron
        con normas IOSA (Operational Safety Audit) otorgada por la Asociación de
        Transporte Aéreo Internacional (IATA)

    © Euromonitor International Ltd 2015. Applicable terms and conditions of use and the disclaimer at the front of this document apply.   44
INTRODUCCIÓN | RESUMEN EJECUTIVO | TAMAÑOS DE MERCADO | DISTRIBUCIÓN | CONSUMIDORES

La economía compartida* se ha extendido a nivel mundial
debido a la adopción rápida y generalizada de la tecnología

                                                                Tecnológico
                                                               (online, móvil)

                                                           Elementos clave
                                                           de la economía
                                                             compartida*

                                                                                                   Económico
                        Social (autenticidad)
                                                                                                     (valor)

© Euromonitor International Ltd 2015. Applicable terms and conditions of use and the disclaimer at the front of this document apply.   45
Economía compartida: interacción entre dos o más sujetos, a través de medios digitalizados o no, que satisface una necesidad real o
potencial, a una o más personas. Por ejemplo, Uber y Airbnb.
INTRODUCCIÓN | RESUMEN EJECUTIVO | TAMAÑOS DE MERCADO | DISTRIBUCIÓN | CONSUMIDORES

La industria de los viajes se combina bien con la economía
compartida

                                                                             Economía compartida en Turismo

                                                                               La economía compartida en el sector de los
                                                                              viajes ofrece diversas oportunidades a futuro,
                                                                                pero la legislación puede llegar a ser una
                                                                                           barrera significativa.

                                                                               La economía compartida en el sector de los
                                                                                  viajes ya no se ocupa únicamente del
                                                                                        alojamiento y el transporte.

                                                                              El crecimiento generalizado de los servicios
                                                                             colaborativos puede ser limitado en las zonas
                                                                             rurales o en las que no tienen fácil acceso a la
                                                                                         tecnología y a Internet.

© Euromonitor International Ltd 2015. Applicable terms and conditions of use and the disclaimer at the front of this document apply.   46
Economía compartida: interacción entre dos o más sujetos, a través de medios digitalizados o no, que satisface una necesidad real o
potencial, a una o más personas. Por ejemplo, Uber y Airbnb.
INTRODUCCIÓN | RESUMEN EJECUTIVO | TAMAÑOS DE MERCADO | DISTRIBUCIÓN | CONSUMIDORES

Actores principales de la economía compartida en el sector de
los viajes

    Mercado online que                                 Empresa de transporte                              HomeAway, fundada en
     facilita las reservas de                            compartido que opera                                2004 como CEH
     alojamiento entre                                   con precios dinámicos y                             Holdings, fue el primer
     anfitriones y huéspedes,                            que cuenta con una                                  gran actor en el sector
     con más de 2 millones                               aplicación móvil para                               de los alquileres para
     de ofertas.                                         conectar a los pasajeros                            vacaciones. Tenía 1,2
                                                         con los conductores                                 millones de ofertas en
                                                         autónomos.                                          noviembre de 2015.
    Su mayor objetivo es ir
     más allá de los
     principales mercados                               Fundada en 2009 en                                 Ha sufrido
     actuales, centrándose                               San Francisco, Uber se                              recientemente debido al
     en los viajeros de                                  ha expandido y                                      rápido aumento de
     negocios y la expansión                             actualmente opera en                                Airbnb.
     internacional.                                      382 ciudades de más de
                                                         60 países a septiembre
                                                         de 2015.

© Euromonitor International Ltd 2015. Applicable terms and conditions of use and the disclaimer at the front of this document apply.   47
INTRODUCCIÓN | RESUMEN EJECUTIVO | TAMAÑOS DE MERCADO | DISTRIBUCIÓN | CONSUMIDORES

        Airbnb alcanzó un TCAC de 252% entre 2009 y 2014

                                                      Airbnb ventas anuales: 2009-2014
                   4.000

                   3.500

                   3.000
Valor (US$ mn)

                   2.500

                   2.000
                                                                                                                                      Australia es el segundo
                                                                                                                                      mercado más grande de
                   1.500                                                                                                                Airbnb después de
                                                                                                                                         Estados Unidos
                   1.000

                     500

                       0
                                2009                  2010                   2011                   2012                   2013                2014
                                                Global         Australia         Rusia         Latinoamérica

        © Euromonitor International Ltd 2015. Applicable terms and conditions of use and the disclaimer at the front of this document apply.              48
INTRODUCCIÓN | RESUMEN EJECUTIVO | TAMAÑOS DE MERCADO | DISTRIBUCIÓN | CONSUMIDORES

          HomeAway obtuvo un crecimiento de 30% en 2014, alcanzando
          más de 4,800 millones de dólares

                                                       HomeAway ventas anuales: 2009-2014
                   6.000

                   5.000

                   4.000
Valor (US$ mn)

                   3.000                                                                                                                  Australia ocupa el cuarto
                                                                                                                                           lugar luego de países
                                                                                                                                          como Estados Unidos y
                   2.000                                                                                                                   Francia en HomeAway

                   1.000

                       0
                                 2009                   2010                   2011                   2012                   2013                2014
                                                   Global                                         Australia

          © Euromonitor International Ltd 2015. Applicable terms and conditions of use and the disclaimer at the front of this document apply.                49
INTRODUCCIÓN | RESUMEN EJECUTIVO | TAMAÑOS DE MERCADO | DISTRIBUCIÓN | CONSUMIDORES

    Airbnb crece, pero no es competencia directa

•       Es una alternativa para quien busca precio. Competencia para hoteles Budget
        pero no para Middle Price y Luxury, porque tiene mayores riesgos. Hay
        quienes buscan en un hotel seguridad y servicio.

•       Riesgos de Airbnb:

          •      Compra y posterior cancelación

          •      Falta de respuesta de dueños

          •      No comunican la dirección de la propiedad arrendada

          •      Sorpresas en llegada (jabón, papel higiénico)

    © Euromonitor International Ltd 2015. Applicable terms and conditions of use and the disclaimer at the front of this document apply.   50
INTRODUCCIÓN | RESUMEN EJECUTIVO | TAMAÑOS DE MERCADO | DISTRIBUCIÓN | CONSUMIDORES

Airbnb crece, pero no es competencia directa

      •      No comunican la dirección de la propiedad arrendada. Ejemplo.

© Euromonitor International Ltd 2015. Applicable terms and conditions of use and the disclaimer at the front of this document apply.   51
INTRODUCCIÓN | RESUMEN EJECUTIVO | TAMAÑOS DE MERCADO | DISTRIBUCIÓN | CONSUMIDORES

Airbnb crece, pero no es competencia directa

      •      Cancelaciones cercanas a la fecha de partida

© Euromonitor International Ltd 2015. Applicable terms and conditions of use and the disclaimer at the front of this document apply.   52
INTRODUCCIÓN
RESUMEN EJECUTIVO
TAMAÑOS DE MERCADO
DISTRIBUCIÓN
CONSUMIDORES
PREGUNTAS
INTRODUCCIÓN | RESUMEN EJECUTIVO | TAMAÑOS DE MERCADO | DISTRIBUCIÓN | CONSUMIDORES

India y China son los países que más realizan viajes de negocio
alcanzando sobre un 30% del total de viajes
                                                                                   Motivo de viaje: 2014
                                               100%
                                                                                                                             2%
                                                       12%
                                               90%                 20%                                        18%
                                                                                                                                          23%
                                                                                 30%            32%
(%) del total de los viajes; Total de viajes

                                               80%

                                               70%

                                               60%

                                               50%                                                                           98%
                                                       88%
                                               40%                 80%                                        82%
                                                                                                                                          77%
                                                                                 70%            68%
                                               30%

                                               20%

                                               10%

                                                0%
                                                      Australia    Brasil        China          India         Japón          Rusia     Corea del Sur

                                                                               Ocio                     Negocios

© Euromonitor International Ltd 2015. Applicable terms and conditions of use and the disclaimer at the front of this document apply.                   54
INTRODUCCIÓN | RESUMEN EJECUTIVO | TAMAÑOS DE MERCADO | DISTRIBUCIÓN | CONSUMIDORES

   Los gastos de los viajeros de Brasil están dominados por las
   compras en el extranjero y consumo de atracciones
                                                                                                Gasto por tipo de actividades: 2014

                                                                 100%
                                                                                                                                 12%
                                                                 90%
    (%) del total de los gastos en actividades; Valor (US$ mn)

                                                                 80%                   41%           38%                                     40%
                                                                                                                                                        52%
                                                                 70%
                                                                         68%                                      65%
                                                                 60%                                                             56%
                                                                                       7%             9%
                                                                 50%
                                                                                       11%                                                               5%
                                                                 40%                                                                         39%         4%

                                                                 30%
                                                                                                                                 1%
                                                                          7%                         53%
                                                                          1%                                      17%
                                                                 20%                   41%                                                              40%
                                                                                                                                 32%         7%
                                                                 10%     24%                                      14%
                                                                                                                                             15%
                                                                  0%                                                 4%
                                                                        Australia      Brasil        China        India          Japón       Rusia   Corea del Sur

                                                                                    Atracciones     Turismo Médico        Spas     Compras

   © Euromonitor International Ltd 2015. Applicable terms and conditions of use and the disclaimer at the front of this document apply.                              55

*Las atracciones incluyen el arte, la cultura y el patrimonio, casinos, museos, parques nacionales, parques temáticos, y otros
INTRODUCCIÓN | RESUMEN EJECUTIVO | TAMAÑOS DE MERCADO | DISTRIBUCIÓN | CONSUMIDORES

En Brasil e India, las familias representan la mayor parte de los
viajes al extranjero
                                                                 Segmentos por grupo de viaje de ocio: 2014
                                         100%
                                                                    8%
                                                 13%                                                                   13%
                                         90%                                           21%
                                                                 11%                                      23%                             27%
                                                 12%                                                                   12%
(%)del total de viajes; Valor (US$ mn)

                                         80%
                                                                                                          4%
                                         70%
                                                                                       24%
                                                                 35%                                                   22%
                                         60%
                                                                                                          32%                             35%
                                         50%     46%
                                                                                       21%
                                         40%
                                                                 23%                                                   39%
                                         30%
                                                                                                                                          11%
                                                                                                          27%
                                         20%                                           24%                                                13%
                                                 29%
                                         10%                     24%
                                                                                       10%                14%          14%                14%
                                          0%
                                                Australia           Brasil             China              India        Japón           Corea del Sur

                                                            Solos            Parejas           Familias       Grupos    Otros

© Euromonitor International Ltd 2015. Applicable terms and conditions of use and the disclaimer at the front of this document apply.                   56
INTRODUCCIÓN | RESUMEN EJECUTIVO | TAMAÑOS DE MERCADO | DISTRIBUCIÓN | CONSUMIDORES

Los consumidores tienden a viajar en los meses más cálidos,
con excepción de viajeros indios y chinos
                                                                                     Viajes por estación del año: 2014
                                              100%

                                                                                                                                               14%
                                               90%                      18%
                                                          23%                                                               23%                            25%
                                                                                             29%            29%
                                               80%                                                                                             15%
                                                                        18%
(%) del total de viajeros; Valor (US$ mn)

                                               70%
                                                          24%                                                               23%
                                                                                                                                                           24%
                                               60%
                                                                                             25%            27%

                                               50%
                                                                        39%                                                                    55%
                                               40%                                                                          29%
                                                          30%                                                                                              29%
                                                                                             21%
                                                                                                            22%
                                               30%

                                               20%

                                                          22%           25%                  25%                            25%                            22%
                                               10%                                                          21%
                                                                                                                                               16%

                                                0%
                                                        Australia       Brasil           China              India           Japón              Rusia   Corea del Sur

                                                                                 Primavera         Verano           Otoño           Invierno

© Euromonitor International Ltd 2015. Applicable terms and conditions of use and the disclaimer at the front of this document apply.                                   57
INTRODUCCIÓN | RESUMEN EJECUTIVO | TAMAÑOS DE MERCADO | DISTRIBUCIÓN | CONSUMIDORES

En China, la población que más viaja se encuentra bajo los 35
años, alcanzando más del 60% del mercado
                                                                  Segmentos por ciclo de vida para ocio: 2014

                                            100%
                                                                                  4%              7%                        4%             4%
                                                    13%          13%
                                            90%                                                                            13%            12%
                                                                                  15%                         23%
                                            80%                                                   24%
                                                    26%          24%
                                                                                  20%
(%) del total de viajeros; Valor (US$ mn)

                                            70%
                                                                                                              20%                         34%
                                                                                                                           36%
                                            60%

                                                                 21%                              30%
                                            50%
                                                    26%                           26%                         20%
                                            40%                                                                                           21%
                                                                                                                           25%
                                            30%                  23%                                          12%
                                                    15%                                           22%
                                            20%                                   28%
                                                                                                              10%
                                                                                                                           15%            25%
                                                    13%          13%
                                            10%                                                   13%
                                                                                                              14%
                                                     6%           8%              7%              4%                        7%             4%
                                             0%
                                                   Australia     Brasil           China           India       Japón        Rusia       Corea del Sur

                                                               0-14       15-24           25-34       35-49    50-64       > 65

© Euromonitor International Ltd 2015. Applicable terms and conditions of use and the disclaimer at the front of this document apply.                   58
INTRODUCCIÓN | RESUMEN EJECUTIVO | TAMAÑOS DE MERCADO | DISTRIBUCIÓN | CONSUMIDORES

Existe oportunidad para el turismo en los distintos grupos etarios

     • Los viajeros de entre 25 y 34 años                                               • Los hijos han dejado el hogar, y
       son el motor de los viajes desde                                                   tienen un ingreso regular, con
       China, India y Corea del Sur.                                                      menos responsabilidades, por lo
                                                                                          que se convierten en los
     • Airbnb, Couchsurfing y otras                                                       consumidores ideales de viajes.
       plataformas colaborativas son
       populares para esta generación.                                                  • Japón y Australia presentan mayor
                                                                                          presencia de este tipo de viajeros.
                                                                                          Sin embargo, los australianos
                                                                                          prefieren los viajes domésticos.

     Millennials*/
                                                                                        Baby Boomers**/
     Consumidores más
                                                                                        Jubilados
     jóvenes

 *Millennials: grupo demográfico que sigue la generación X. Incluye a las personas que nacen entre los años 1980 y 2000s.
 **Baby Boomers: grupo demográfico que nació durante los años posteriores a la guerra cuando hubo un repunte en las tasas de natalidad.
 Incluye a las personas que nacen entre los años 1946 y 1965.
© Euromonitor International Ltd 2015. Applicable terms and conditions of use and the disclaimer at the front of this document apply.      59
INTRODUCCIÓN | RESUMEN EJECUTIVO | TAMAÑOS DE MERCADO | DISTRIBUCIÓN | CONSUMIDORES

Potencial: los adultos mayores son cada vez más…

                                                                          % de la población que tiene más de 64 años
                                         35%

                                                                                     Población de más de 64 años en MM (total 7 países)
                                         30%
                                                                                                              +41 MM               282         +67 MM           349
                                                                                                      241
                                         25%
% de la población de más de 64 años

                                         20%

                                         15%                29%
                                                      27%
                                                23%
                                         10%
                                                                              16%               16%                 15%
                                                                        15%
                                                                  14%                     13%           13% 14%                          12%
                                          5%                                        11%
                                                                                                                                 10%                      10%
                                                                                                                            8%
                                                                                                                                               7% 8%                   6%
                                                                                                                                                                 5% 5%

                                          0%
                                                   Japón            Australia       Corea del Sur           Rusia                China           Brasil               India

                                                                                            2010        2015         2020

© Euromonitor International Ltd 2015. Applicable terms and conditions of use and the disclaimer at the front of this document apply.                                          60
INTRODUCCIÓN | RESUMEN EJECUTIVO | TAMAÑOS DE MERCADO | DISTRIBUCIÓN | CONSUMIDORES

…y tienen tiempo y deseos de viajar…

                        https://www.youtube.com/watch?v=r4L3yGCGLQk

© Euromonitor International Ltd 2015. Applicable terms and conditions of use and the disclaimer at the front of this document apply.   61
Principales Recomendaciones

                                      En el corto plazo (a partir de este año), apuntar a
                                      mercados más estables económicamente
                                      • Corea del Sur, India, Japón y Australia son los países que
                                        se espera tendrán mayor estabilidad los próximos años.

                                        Abordar los mercados que tienen mayor
                                        incertidumbre económica, con estrategias de
                                        largo plazo (2 a 5 años más, cuando su situación
                                        económica mejore)
                                        • Para Rusia, Brasil y China, Perú debería generar
                                          estrategias apuntando a una mejor conectividad con estos
                                          países. Por ejemplo, impulsar vuelos con menos escalas
                                          desde China.

© Euromonitor International Ltd 2015. Applicable terms and conditions of use and the disclaimer at the front of this document apply.   62
Principales Recomendaciones

                                        Apuntar a generaciones jóvenes en países en
                                        vías de desarrollo
                                        • En China, India, Corea del Sur los consumidores más
                                          jóvenes son los que impulsan el crecimiento del turismo.
                                        • Aumentar la promoción y comunicación en redes sociales
                                          y nuevos canales para atraer al publico joven. Algunos
                                          ejemplos son Instagram, Twitter, Facebook, Spotify,
                                          Snpachat, entre otros.

                                        Desarrollar canales online y los dispositivos
                                        móviles
                                        • Perú tiene la oportunidad de mejorar su exposición como
                                          destino turístico al asociarse con los operadores online
                                          claves que tienen presencia en los países objetivo.

© Euromonitor International Ltd 2015. Applicable terms and conditions of use and the disclaimer at the front of this document apply.   63
Principales Recomendaciones

                                         Posicionar a Perú como un destino de
                                         experiencias y compras
                                         • Parte del turismo emisor desde los países en estudio viaja
                                           para visitar atracciones, tales como arte, cultura y
                                           patrimonio, casinos, museos, naturaleza y parques
                                           temáticos. Perú tiene la oportunidad de destacar cultura y
                                           patrimonio, naturaleza y casino, junto con la posibilidad de
                                           hacer compras.

                                         Posicionar a Perú como uno de los destinos
                                         importantes de visitar en viajes de múltiples
                                         destinos a Latinoamérica
                                         • Promover Perú como parte importante de los viaje con
                                           múltiples destinos dentro de Latinoamérica, ya que las
                                           distancias son largas y los visitantes buscan disfrutar de
                                           más de un país.

© Euromonitor International Ltd 2015. Applicable terms and conditions of use and the disclaimer at the front of this document apply.   64
INTRODUCCIÓN
RESUMEN EJECUTIVO
TAMAÑOS DE MERCADO
DISTRIBUCIÓN
CONSUMIDORES
PREGUNTAS
¿Preguntas?

© Euromonitor International Ltd 2015. Applicable terms and conditions of use and the disclaimer at the front of this document apply.   66
Muchas gracias

© Euromonitor International Ltd 2015. Applicable terms and conditions of use and the disclaimer at the front of this document apply.   67
CONTACT DETAILS
Pamela Fernandez                  Geana Barbosa
Associate Consultant              Consulting Group Business Development
Tel: +56 2 2915 7200 x 7246       Tel: +56 2 2915 7200 x7234
Pamela.Fernandez@euromonitor.cl   Geana.Barbosa@euromonitor.cl

Helen Smith                       Fabiana Beregeno
Consulting Manager                Senior Client Consultant Sales
Tel: +56 2 2915 7200 x 7236       +1 (312) 922 1115 x8317
Helen.Smith@euromonitor.cl        Fabiana.Beregeno@euromonitor.com
También puede leer