Consumo de Energía y Emisiones de Gases de Efecto Invernadero en Chile 2007-2030 y Opciones de Mitigación Energy Consumption, Greenhouse Gas ...
←
→
Transcripción del contenido de la página
Si su navegador no muestra la página correctamente, lea el contenido de la página a continuación
Consumo de Energía y Emisiones de Gases de Efecto Invernadero
        en Chile 2007-2030 y Opciones de Mitigación

Energy Consumption, Greenhouse Gas Emissions and Mitigation
               Options for Chile, 2007-2030

                          June 2009
PROGRAMA DE GESTIÓN Y ECONOMÍA AMBIENTAL (PROGEA)
               Departamento de Ingeniería Industrial
                     UNIVERSIDAD DE CHILE

PROGRAM FOR ENVIRONMENTAL ECONOMICS AND MANAGEMENT (PROGEA)
               Department of Industrial Engineering
                     UNIVERSITY OF CHILE

                 Raúl O`Ryan - Manuel Díaz - Jacques Clerc
                         Junio 2010 / June 2010

 Esta publicación ha sido elaborada con la asistencia de la Unión Europea.
El contenido de esta publicación es responsabilidad exclusiva del consorcio
del proyecto JELARE y de ninguna manera debe considerarse que refleja los
                   puntos de vista de la Unión Europea.

  This publication has been produced with the assistance of the European
Union. The content of this publication is the sole responsibility of the JELARE
 project consortium and can in no way be taken to reflect the views of the
                              European Union.

                              Auspiciado por/ Sponsored By
2

Índice / Table of Contents

		        Agradecimientos / Acknowledgements                                                            5
    1.    Introducción / Introduction                                                                   6
    2.    Evolución Histórica de las Emisiones de GEI en Chile: 1986 – 2006 / Historical Evolution
          of GHG Emissions in Chile: 1986-2006                                                          9
    2.1   Inventarios de Emisiones de GEI / GHG Emissions Inventories                                   12
    2.2   Tipos de Emisiones y Métodos de Estimación Empleados / Types of Emissions and Estimation
          Methods Employed                                                                              13
    2.3   Evolución de Emisiones de GEI Asociadas a Combustión / Evolution of GHG Emissions
          Associated With Combustion                                                                    14
    2.4   Emisiones Procesos Industriales, Forestal y Cambio de Uso de Suelo / Emissions From
          Industrial Processes, Forestry and Land Use Change                                            16
    2.5   Inventario de Emisiones Totales: Año 2005 / Inventory of Total Annual Emissions: 2005         19
    2.6   Indicadores Asociados a las Emisiones de GEI en el Sector Energía: 1990 – 2006 / Indicators
          Associated with GHG Emissions in the Energy Sector: 1990 – 2006                               21
    3.    Proyección del Consumo Energético Sectorial y de las Emisiones / Projections of Energy
          Consumption and Emissions by Sector                                                        25
    3.1   Proyección del Balance de Secuestro y Emisiones del Sector Forestal y Cambio de Uso de Suelo/
          Projection of the Balance of Capture and Emissions for the Forestry and Land Use Change
          Sectors                                                                                    26
    3.2   Proyección de las Emisiones de GEI Asociadas a Procesos Industriales / Projection of GHG
          Emissions Associated with Industrial Processes                                             28
    3.3   Consumo Energético Sectorial y Emisiones de GEI de Principales Sectores Consumidores
          de Energía: 2007 – 2030 / Energy Consumption and Emissions of GHG by Principal Energy
          Consuming Sectors : 2007 – 2030                                                            29
    3.3.1 Metodología de Proyección de Consumos Energéticos / Methodology for Projecting Energy
          Consumption                                                                                29
3

Índice / Table of Contents

 3.3.2 Sectores Considerados / Sectors Considered                                               32
 3.3.3 Consumos de Energéticos Proyectados 2007 – 2030 / Projected Energy Consumption
       2007 – 2030                                                                              33
 3.4   Proyecciones Demandas Energéticas en Generación Eléctrica y Otros Centros
       de Transformación / Energy Demand Projections in Electricity Generation and Other
       Transformation Centers                                                                   34
 3.4.1 Proyecciones Demandas Energéticas en Generación Eléctrica / Electricity Generation
       Demand Forecast                                                                          35
 3.4.2 Proyecciones Demandas Energéticas en Otros Centros de Transformación / Energy Demand
       Forecast for Other Transformation Centers                                                37
 3.5   Emisiones Asociadas a uso de Combustibles de Demanda Final / Emissions Associated With
       Final Demand Fuel Use                                                                    39
 3.6   Emisiones Asociadas a Centros de Transformación / Transformation Centers’ Associated
       Emissions                                                                                40
 3.7   Emisiones Netas de GEI de Chile / Chile’s Net GHG Emissions                              41
 4.    Potencial de Abatimiento e Instrumentos Económicos y Regulatorios Factibles de ser
       Aplicados / Abatement Potential and Feasibly Implemented Economic and Regulatory
       Mechanisms                                                                               45
 4.1   Gestión de Demanda, Mejoramiento Tecnológico y Reducción del Nivel de Actividad en
       Transporte / Demand Management, Technological Improvement and Reduced Transportation
       Activity                                                                                 49
 4.2   Gestión de Demanda en Sector Comercial, Público y Residencial / Demand Management
       in the Commercial, Public and Residential Sector                                         52
 4.3   Gestión de Demanda en Sector Industrial y Minero / Demand Management in the Industrial
       and Mining Sector                                                                        56
4

Índice / Table of Contents

    4.4   Reducción de la Intensidad en Carbón de las Tecnologías de Generación Eléctrica / Carbon
          Intensity Reduction in Electricity Generating Technologies                                 62
    4.5   Potencial Agregado de Reducción de Emisiones de Gases de Efecto Invernadero / Aggregate
          Greenhouse Gas Emission Reduction Potential                                                68
    5.    Análisis de Escenarios de Reducción de Emisiones de GEI en Chile / Analysis of GHG Emission
          Reduction Scenarios in Chile                                                               75
    5.1   Escenario Early Actions y de Reducción Máxima de Emisiones de GEI / Early Actions and
          Maximum GHG Emissions Reduction Scenarios                                                  78
    6.    Conclusiones y Bases para una Estrategia Chilena de Mitigación de Gases de Efecto
          Invernadero / Conclusions and a Basis for a Chilean Greenhouse Gas Mitigation Strategy     83
    6.1   Conclusiones Cuantitativas Relevantes para Chile / Relevant Quantitative Conclusions
          for Chile                                                                                  88
    6.2   Recomendaciones para una Estrategia Chilena / Recommendations for a Chilean Strategy 90
5

Agradecimientos                                     Acknowledgements

Los autores agradecen a los profesionales de        The authors wish to thank the professionals
Endesa Latinoamérica, por sus observaciones y       at Endesa International for their observations
constantes aportes a este estudio, sin los cuales   and contributions to this study. Without
no se habría logrado la misma rigurosidad y         their valuable support, we would not have
calidad de los resultados. También el apoyo de la   been able to achieve the degree of rigor and
Unión Europea, a través del Proyecto Conjunto       quality obtained. Also the assistance of the
de Universidades Europeas y Latinoamericanas        European Union through the Joint European-
en Energía Renovable ((JELARE) desarrollado         Latin American Universities Renewable Energy
como parte del Programa ALFA III de la Comisión     Project (JELARE), undertaken as part of the ALFA
Europea y al Proyecto “Entidad Promotora del        III Programme of the European Commission
Mecanismo de Desarrollo Limpio en Chile”            and to the project “Entidad Promotora del
financiado por INNOVA CORFO.                        Mecanismo de Desarrollo Limpio en Chile”
                                                    sponsored by INNOVA CORFO.
También queremos agradecer al ex Presidente
de la República Sr. Ricardo Lagos Escobar y al      We also wish to thank the former President of
Director de la Comisión Nacional del Medio          the Republic, Mr. Ricardo Lagos Escobar and
Ambiente Sr. Alvaro Sapag, por entregarnos sus      the Director of the National Commission on
visiones respecto de la estrategia que debiera      the Environment, Mr. Alvaro Sapag, for sharing
asumir Chile frente a la amenaza del Cambio         their vision of the strategy Chile should adopt to
Climático.                                          deal with the threat of climate change.

Además, a la Sra. Christiana Figueres Vice          Also we wish to thank Mrs. Christiana
Presidenta del Bureau de la Convención Marco        Figueres, Vice President of the Bureau of the
sobre el Cambio Climático de las Naciones           United Nations Framework Convention on
Unidas (UNFCCC) y asesora de Endesa                 Climate Change (UNFCCC) and adviser to
Latinoamérica, al Sr. Eduardo Sanhueza              Endesa International, Mr. Eduardo Sanhueza,
consultor de CEPAL y al Sr. Cristobal Huneeus,      consultant to CEPAL (Economic Commission
Asesor del Ministerio de Hacienda; quienes          for Latin America), and Mr. Cristóbal Huneeus,
aportaron sus conocimientos en los distintos        Adviser Ministry of Finance, all of whom lent
ámbitos que se abordaron en este estudio.           their knowledge about the different areas
                                                    covered in this study.
Por último, a la valiosa labor de nuestros
ingenieros y ayudantes quienes permitieron          Finally, we wish to acknowledge the valuable
obtener los resultados que se presentan en este     work of the engineers and assistants who
documento: Sr. Carlos Gherardelli (q.e.p.d.),       helped us obtain the results presented in this
Sr. Mauricio Pereira, Srta. Carolina Rojas y Sr.    document: the late Mr. Carlos Gherardelli, Mr.
Gonzalo Valdés.                                     Mauricio Pereira, Ms. Carolina Rojas and Mr.
                                                    Gonzalo Valdés.
6

1.     Introducción                               1.     Introduction

Endesa Latinoamérica solicitó al Programa         Endesa International asked the Program for
de Gestión y Economía Ambiental de la             Environmental Economics and Management
Universidad de Chile llevar a cabo el estudio     of the University of Chile to conduct a study
“Emisiones de Gases de Efecto Invernadero         on “Emissions of Greenhouse Gases (GHG)
(GEI) en Chile: Antecedentes para el desarrollo   in Chile: Background for the Development of
de un marco regulatorio y evaluación de           a Regulatory Framework and Evaluation of
instrumentos de reducción”, cuyo objetivo         Avenues of Reduction.” The main objective of
principal fue proyectar la evolución de las       the study was to project the evolution of GHG
emisiones de gases de efecto invernadero          emissions in Chile and evaluate alternative
en Chile y evaluar políticas alternativas e       policies and specific instruments to deal with
instrumentos específicos que permitan             future contingencies the country might face in
enfrentar el escenario futuro para el país        this area. The study has focused on emissions
en este ámbito. El estudio se ha centrado         resulting from fossil fuel combustion in
en las emisiones producto del consumo de          stationary and mobile sources and, at a
combustibles fósiles en fuentes fijas y fuentes   lesser level of detail, emissions from industrial
móviles y también incluye, con menor grado de     processes and from changes in land use and
detalle, las emisiones de procesos industriales   forestry.
y por cambio de uso de suelos y forestales.
                                                  The project identified and assessed the
En el proyecto se identificaron y evaluaron las   main measures to reduce greenhouse gases
principales medidas de reducción de gases de      in the transportation, commercial, public
efecto invernadero en los sectores transporte;    and residential, industrial, mining, and
comercial, público y residencial; industrial y    electricity- generating sectors. Additionally,
minero y generación de energía eléctrica;         the project identified economic and regulatory
además de identificar los instrumentos            instruments that would help to promote and
económicos y regulatorios que permitirían         implement the proposed measures.
promover e implementar las medidas
propuestas.                                       For each abatement option, implementation
                                                  costs and reduction potentials were estimated
Para cada opción de abatimiento se han            utilizing expert opinion, company and
estimado sus costos de implementación y           regulatory agency information, as well as
potenciales de reducción de manera realista y     information gathered through a review of
sobre la base de opinión experta, información     the national and international literature. In
de empresas y organismos reguladores, así         all cases the estimated cost of the measures
7

como la información recopilada a través            reflects the real costs to the society of adopting
de la literatura tanto a nivel nacional como       them.
internacional. En todos los casos, el costo
estimado de las medidas corresponde al costo       Taking all of the above into account, a GHG
real para la sociedad de adoptarlas.               emissions abatement curve for Chile was
                                                   created, which shows the reduction potentials
Sobre la base de estos antecedentes, se            and costs of the different measures assessed.
construye la curva de abatimiento de emisiones     The curve is ordered from the least expensive
de gases de efecto invernadero para Chile,         (measures with negative costs) to the most
la que muestra los potenciales de reducción        expensive per ton of CO2e reduction, and the
y costos de las distintas medidas evaluadas,       total cost of the maximum potential possible.
ordenadas desde las más baratas (medidas
con costos negativos) a las más caras. Ello        Two GHG emissions reduction scenarios for
permite estimar el potencial de mitigación del     Chile were developed accordingly to combine
país a distintas exigencias de costo máximo de     the potential reductions available through the
reducción por tonelada de CO2e reducida y el       different measures. The scenarios correspond
costo total del máximo potencial posible.          to the so-called “early actions” (actions
                                                   that have been carried out in Chile in recent
A partir de estos antecedentes se construyen       months) and the maximum possible emissions
dos escenarios de reducción de emisiones de GEI    reduction, which includes the aggregate
en Chile, en ellos se combinan las reducciones     interactions of the majority of the measures.
potenciales de las distintas medidas. Los          This is not a straightforward and simple
escenarios corresponden a las llamadas “early      exercise, as in no case does the result equal
actions” (medidas tempranas que se han             the sum of the reductions of each separate
realizado en Chile en los últimos meses) y la      measure. The Long Range Energy Alternative
reducción máxima posible, que incluye la mayor     Planning System (LEAP) model was used to
parte de las medidas interactuando de manera       allow the different variables to interact in
agregada. Este no es un ejercicio directo y        equilibrium in accordance with the projected
sencillo, ya que en ningún caso equivale a la      energy demand for each sector.
suma de las reducciones de las medidas por
separado. Para ello se utilizó el modelo LEAP
que permite hacer interactuar las distintas
variables en equilibrio, de acuerdo a la demanda
proyectada de energéticos para cada sector.
8

Finalmente, se presentan las bases para una       In conclusion, the foundations for a Chilean
política chilena de reducción de emisiones        policy on GHG emissions reduction are
de gases efecto invernadero. Se discuten          presented. The most appropriate measures
cuales son las medidas más convenientes           to implement, according to their cost
de implementar, de acuerdo a su costo             effectiveness, are reviewed along with
efectividad, las palancas o instrumentos que      Instruments to make implementation feasible.
podrían viabilizar su implementación y como       Finally, how to consider all of the above in a
considerar todo ello en una propuesta de          proposed climate change policy that is realistic
política de cambio climático que sea realista     for the country in the international context
para el país, dado el contexto internacional      of climate change and takes into account
respecto al cambio climático y las implicancias   the economic implications that could stem
económicas que podría traer una postura           from the country’s stance towards the United
del país frente a la Convención Marco de las      Nations Framework Convention on Climate
Naciones Unidas para el Cambio Climático          Change (CMNUCC) is discussed.
(CMNUCC).

2
Evolución Histórica de las Emisiones de GEI en Chile: 1986 – 2006
Historical Evolution of GHG Emissions in Chile: 1986-2006
11

2.        Evolución Histórica de las                             2.        Historical Evolution of GHG
          Emisiones de GEI en Chile:                                       Emissions in Chile: 1986-2006
          1986 – 2006

Hasta la fecha se han desarrollado en el país                    To date, four major GHG inventory initiatives
cuatro grandes iniciativas de inventarios de                     have been conducted in this country. The first
emisiones de GEI. El primer estudio, realizado                   study, conducted in 1997 by the University
en 1997 por el Programa de Investigación en                      of Chile’s Energy Research Program (PRIEN)
Energía de la Universidad de Chile (PRIEN), se                   focused on energy sector emissions up to
centró en las emisiones del sector energía al                    19931. The second study, also developed by
año 19931. El segundo de ellos, desarrollado                     the PRIEN in 1999, consisted of an update to
también por el PRIEN en 1999, consistió en                       1994 that included additional emissions from
una actualización al año 1994 que incluyó                        industrial processes and solvent use2. A third
adicionalmente las emisiones de procesos                         PRIEN study described the evolution of GHG
industriales y uso de solventes2. Un tercer                      emissions in these same sectors between
estudio efectuado por PRIEN consistió en                         1996 and 19983. In 2004 the Directorate of
presentar la evolución de las emisiones de GEI                   Scientific and Technological Research at the
en dichos sectores entre los años 1986 y 19983.                  Pontificia Catholic University of Chile (DICTUC)
En el año 2004, la Dirección de Investigaciones                  conducted a fourth study which estimated the
Científicas y Tecnológicas de la Pontificia                      GHG emissions in Chile to 20014.
Universidad Católica de Chile (DICTUC) llevó a
cabo un cuarto estudio en el que se estimaron                    The results of these studies are the starting
las emisiones de GEI en Chile al año 20014.                      point for estimating emissions in the periods
                                                                 for which there are no emissions estimates and
Los resultados de estos estudios son la base de                  for emission projections through 2030.
partida para la estimación de emisiones en los
períodos en que no existen estimaciones de
emisiones y para la posterior proyección de las
mismas al año 2030.

1    “Inventario de Emisiones de Gases de Efecto Invernadero     1    “1993 Energy Sector Inventory of Greenhouse Gas
     Sector Energía Año 1993”.
                                                                      Emissions”.
2    “Inventario de Emisiones de Gases de Efecto Invernadero
     Energía, Procesos Industriales y Uso de Solventes 1993-     2    “1993-1994 Inventory of Greenhouse Gas Emissions, Energy,
     1994”.                                                           Industrial Processes and Solvent Use”.
3    “Inventario de emisiones de gases de efecto invernadero     3    “1986-1998 Inventory of Greenhouse Gas Emissions, Energy,
     energía, procesos industriales y uso de solventes, Chile         Industrial Processes and Solvent Use, Chile”.
     1986-1998”.
                                                                 4     “Greenhouse Gases (GHG), Chile’s Case, 2001”.
4    “Gases de Efecto Invernadero (GEI) para el caso de Chile”
     año 2001.
12
2.1 Inventarios de Emisiones de GEI 2.1 GHG Emissions Inventories
Para la elaboración de la serie anual de The basis for the preparation of the annual
emisiones de GEI, tanto a nivel nacional (time) series of GHG emissions, both at the
como sectorial, se partió de la información national and sector level, was the information
suministrada por los Inventarios Nacionales de provided by the National GHG Inventories
GEI correspondientes a los años 1993, 1994 y la for 1993, 1994, and the estimated changes
evolución estimada entre los años 1986 y 1998. between 1986 and 1998. The aforementioned
Ellos se basan en la metodología de cálculo studies used the methodology developed
elaborada por el Panel Intergubernamental by the Intergovernmental Panel on Climate
sobre Cambio Climático (IPCC) y la Change (IPCC) and the Organization for Trade
Organización para el Comercio y el Desarrollo and Development (OECD). These studies
Económico (OCDE). Este conjunto de estudios provide the sole, and most current, official
es la única y más actualizada fuente oficial de source that Chile has access to regarding GHG
datos de emisiones de GEI con la que cuenta emissions, and thus constitute the official
Chile y serán considerados valores oficiales de baseline figures.
partida para este estudio.
While the Intergovernmental Panel on Climate
Si bien el Panel Intergubernamental sobre Change (IPCC) has considered 1990 as the
Cambio Climático (IPCC) ha considerado 1990 base year for GHG emissions analysis, this was
como el año base para los análisis de emisiones an abnormally dry year in Chile, and to use it
de GEI, este año fue anormalmente seco would deliver an erroneous starting point. As
en Chile, por lo que considerarlo entregaría a result, 1994 is the initial year for the baseline
una base de partida errónea. Además, 1994 and mitigation scenarios.
es el año inicial de los escenarios base y de
mitigación. A methodology similar to that used in the
PRIEN (2000) study is used for the inventories
Respecto a los inventarios correspondientes al corresponding to the 1998-2006 period, based
período 1998-2006, se sigue una metodología on the existing data in the National Energy
similar a la utilizada en el estudio PRIEN Commission’s (CNE) Energy Balance and the
(2000), la cual se basa en la consideración de main variables that define the behavior of
los datos existentes en los Balances de Energía emissions in each sector.
de CNE y de las principales variables que
definen el comportamiento de las emisiones The official source of information for the
en cada sector. development of the inventories is the Energy
Balance from the CNE. The sectors studied are
La fuente oficial de información para el classified according to the IPCC categories,
desarrollo de los inventarios son los Balances which are equivalent to the existing categories
de Energía de la Comisión Nacional de Energía in the CNE’s Energy Balance (albeit with
(CNE). Los sectores estudiados se clasifican de different names). The equivalence between
acuerdo a la categorización del IPCC, la que sectors of both institutions is presented in the
es equivalente a las categorías existentes en table below.
los Balances de Energía de la CNE (aunque con
nombres diferentes). La equivalencia entre
sectores de ambas instituciones se presenta
en el siguiente cuadro.13
Cuadro 1: Sectores y Equivalencia entre Table 1: Sectors and Equivalence Between
Sectores IPCC y CNE IPCC and CNE Sectors
Sectores IPCC / IPCC Sectors Sectores CNE / CNE Sectors
Sector Energía
Centros de Transformación /
Industrias de la energía / Energy Industries
-Energy
-Transformation Centers
Industrias Manufactureras y Construcción
Agricultura y Pesca / -Manufacturing and Industrial y minero / Industrial and Mining
Construction Industries -Agriculture and
Fishing
Transporte / Transportation Transporte / Transportation
Comercial, institucional y residencial / Comercial, institucional y residencial /
Commercial, Institutional and Residential Commercial, Institutional and Residential
Fuente: Elaboración propia Source: Developed in-house
2.2 Tipos de Emisiones y Métodos 2.2 Types of Emissions and
de Estimación Empleados Estimation Methods Employed
Las emisiones de los inventarios de GEI Inventories of GHG emissions correspond to
consideradas corresponden a aquellas que those produced from combustion processes.
se producen a partir de los procesos de A distinction is made between CO2 emissions
combustión. Se hace distinción entre las and other gases (CH4, N2O, CO, NOx, COVNM
emisiones de CO2 y las del resto de gases (CH4, y SO2).
N2O, CO, NOx, COVNM y SO2).
In order to compare emissions of different
A fin de poder comparar las emisiones de los GHGs, originally expressed in Gg of each
distintos GEI, expresadas originalmente en Gg particular gas, they were converted to Gg of
de cada gas en particular, se las convirtió en Gg CO2e. To do this the Global Warming Potentials
de CO2e. Para ello, se utilizaron los Potenciales (GWP) were adopted from IPCC’s Second
de Calentamiento Global (PCG) del Segundo Assessment Report (SAR).
Informe de Evaluación (SAR) del IPCC.
Depending on how the calculations are made,
De acuerdo a la forma en que se realizan los there are two separate ways of estimating
cálculos se consideran dos formas distintas GHG emissions: “top-down” and “bottom-
para estimar las emisiones de los GEI: top- up”. In the case of CO2, a top-down estimate
down y bottom-up (o uso final). Para el caso is used because it delivers a quick, simple and
del CO2, se utiliza la estimación top-down, la relatively reliable estimate. It is based on fuel
cual entrega una estimación en forma rápida, characteristics and requires, as compared
sencilla y relativamente confiable. Dicho to bottom-up estimates, little and easily
enfoque se basa en las características de los available information. For this method, what
combustibles y requiere –en comparación con matters most is what and how much is being
el método bottom-up– poca información, la combusted.
que es de fácil acceso. En este método lo que
interesa fundamentalmente es qué y cuánto se
combustiona.14
En el caso de los Procesos Industriales, In the case of Industrial Processes, the
correspondientes a las emisiones de GEI como principal sources of GHG emissions, which are
producto de las actividades industriales, no products of industrial activity not originating
provenientes de la combustión de energéticos; from energy combustion, are processes
las principales fuentes de emisión son los that transform inputs both physically and
procesos que transforman insumos tanto chemically. The emissions sources studied
física como químicamente. Las fuentes relevant to Chile are the production and /
emisoras estudiadas, relevantes para Chile, or use of cement, asphalt, glass, nitric acid,
son la producción y/o uso de cemento, asfalto, petrochemical products (ethylene, styrene,
vidrio, ácido nítrico, productos de la industria etc…) iron and steel, ferroalloys, copper, paper
petroquímica (etileno, estireno, etc.), hierro y and pulp, food and alcoholic beverages. This
acero, ferroaleaciones, cobre, papel y celulosa, study estimates the emissions produced by the
alimentos y bebidas alcohólicas. En este caso, cement, steel, and iron processes.
en el estudio se estimarán las emisiones
producto de los procesos del cemento, y el
acero y hierro.
2.3 Evolución de Emisiones de GEI 2.3 Evolution of GHG Emissions
Asociadas a Combustión Associated With Combustion
En el año 2000, el PRIEN5 desarrolló un In 2000 PRIEN carried out a study of the
estudio de la evolución de las emisiones de evolution of GHG emissions between 1986 and
GEI entre los años 1986 y 1998, empleando 1998, using the methodology detailed above.
la metodología detallada anteriormente. The projections for the inventory for the period
La proyección del inventario realizada para 1986-2006 were developed along the same
el período 1986-2006 sigue la misma línea methodological lines as used by PRIEN for their
metodológica que la evolución elaborada por 1986-1998 period study, which assessed the
el PRIEN para el período 1986-1998, donde se relevance of CO2, CH4, N2O, CO, NOx, COVNM,
evalúa la relevancia de las emisiones de CO2, SO2 emissions in Chile, produced by fossil fuel
CH4, N2O, CO, NOx, COVNM, SO2 en Chile, combustion. Consumption data from the
producidas por la combustión de combustibles CNE’s National Energy Balance were used in
fósiles. Para dicha estimación se utilizaron los developing the estimate.
datos de consumo del Balance Nacional de
Energía de la CNE. In order to estimate emissions from energy
consumption, the Long Range Energy Alternative
Para poder estimar las emisiones a partir de Planning System (LEAP) model was used. This tool
los consumos energéticos, se utiliza el modelo is one of the most widely used worldwide, with
Long range Energy Alternatives Planning hundreds of users in more than 140 countries,
System (LEAP). Esta herramienta es una de and has served as a means of communicating
las más utilizadas en el mundo con cientos de with the IPCC. The model basically uses the IPCC’s
usuarios en más de 140 países y ha servido emission factors and allows for the structuring of
como medio de comunicación con la IPCC. information according to the different end-use
Utiliza básicamente los factores de emisión del consumer sectors.
IPCC y permite estructurar la información de
5 “Inventario de emisiones de gases de efecto invernadero 5 “1986-1998 Inventory of Greenhouse Gas Emissions, Energy,
energía, procesos industriales y uso de solventes, Chile Industrial Processes and Solvent Use, Chile.” Program for
1986-1998” PRIEN 2000. Energy Study and Research (PRIEN) 2000.15
acuerdo a los distintos sectores consumidores The results are presented in the following
de uso final. Los resultados se presentan en la figure.
figura siguiente.
Figura 1: Evolución Sectorial de las Emisiones Figure 1: Evolution of GHG Emissions by
de GEI 1986-2006 Sector 1986-2006
70 000
60 000
GHG Emissions (Thousands T CO2e)
Emisiones GEI (Miles T CO2e)
50 000
40 000
30 000
20 000
10 000
0
1986
1987
1988
1989
1990
1991
1992
1993
1994
1995
1996
1997
1998
1988
2000
2001
2002
2003
2004
2005
2006
Años
Years
Centros de Transformación Sector Energía Transporte Industrial y Minero Comercial, Público y Residencial
Transformation Centers Energy Sector Transportation Industrial and Mining Commercial, Public and
Recidential (CPR)
Fuente: Elaboración propia Source: Developed in-house
A partir de los datos de la figura anterior se Data from the figure show that the highest
puede concluir que los sectores más emisores GHG emitting sectors up to 2006 have been
de gases de efecto invernadero al año 2006 Transportation (35%), Industrial and Mining
han sido transporte (35%), industrial y minero (22%), and Transformation Centers (33%).
(22%) y centros de transformación (33%). Together they account for 90% of emissions
Ellos comprenden el 90% de las emisiones por from fuel consumption in Chile.
concepto de consumo de combustibles en el
país. The Industrial and Mining, Transportation,
and Transformation Centers are the sectors
El sector industrial y minero, transporte that have grown the most proportionally.
y centros de transformación han sido los In effect, the Industrial and Mining sector
sectores que han crecido proporcionalmente has increased its consumption by 1.6 times
en mayor medida. En efecto, el sector industrial compared to 1986, Transport by 2.3 times,
y minero ha aumentado su consumo en 1,6 and Transformation Centers 3.6 times. On
veces respecto a 1986, transporte en 2,3 veces average, the country’s energy consumption16
y centros de transformación en 3,6 veces. En increased 2.3 times compared to 1986.
promedio, el consumo energético del país
aumento 2,3 veces respecto al año 1986. In terms of all emissions, these doubled
relative to 1990 and have grown 2.2 times
En el caso de las emisiones, estas se duplicaron relative to 1986.
respecto al año 1990 y crecieron 2,2 veces
respecto al año 1986.
2.4 Emisiones Procesos 2.4 Emissions From Industrial
Industriales, Forestal y Processes, Forestry and Land
Cambio de Uso de Suelo Use Change
Existen otros sectores emisores/capturadores There are other GHG emitting/capturing
de GEI. Por ejemplo, el sector forestal y Cambio sectors, for example the Forestry sector and
de Uso de Suelo que representa un sumidero Land Use Change which represent a net sink by
neto que captura el equivalente al 57% de las capturing the equivalent of 57% of emissions
emisiones de los otros sectores. from other sectors.
Las principales actividades capturadoras/ The main capturing/emitting activities
emisoras consideradas en el inventario, además considered in the inventory, in addition
de las emisiones por consumo de combustibles, to the emissions from fuel consumption
son: Procesos industriales, Agricultura, Manejo are: Industrial Processes, Agriculture,
de desechos, Manejo forestal, Abandono Waste Management, Forest Management,
de suelo manejado, Incendios forestales y Abandonment of Managed Land, Forest Fires,
Conversiones (conversión de bosque nativo en and Conversions (conversion of native forest to
agricultura o en bosque comercial). agriculture or commercial forestry).
En este estudio, además de las emisiones por In this study, in addition to the emissions from
combustión de combustibles, se estiman las fuel combustion, emissions are estimated
emisiones de procesos industriales y de cambio from industrial processes as well as forestry
de uso de suelo y forestal. Cabe hacer notar que and land use changes. It should be noted that
las metodologías que se utilizan para estos dos the methodologies used for these two sectors
sectores son de bastante menor detalle que las are substantially less detailed than those for
de combustión en fuentes fijas y móviles. combustion in stationary and mobile sources.
Es importante destacar que la estimación It is important to highlight that the estimate
desarrollada para cambio de uso de suelo y developed for land use change and forestry is
forestal es única (al menos en lo publicado) the only one available (at least in the published
en el país y considera la mejor información literature) for Chile. It considers the best
disponible, además de tratar de subsanar los information available and tries to correct the
errores e incoherencias encontrados en los errors and inconsistencies found in previous
estudios anteriores. studies.
A continuación se explica brevemente la The following briefly explains the estimates
estimación de emisiones/capturas de manejo for emission/capture of Forest Management,
forestal y abandono de suelo manejado, Abandonment of Managed Land, Forest Fires17
incendios forestales y conversiones, además de and Conversion, as well as industrial processes.
procesos industriales.
Forest Management and Abandonment of
Manejo Forestal y abandono de suelo Managed Land. This category is derived from
manejado. Corresponde al balance entre the overall balance of emissions and captures
emisiones y capturas que se deriva del resulting from the annual increase in biomass
incremento anual de biomasa de plantaciones plantation and native forest management.
y bosque nativo gestionado.
Fire. Due to the absence of an inventory of the
Incendios. Debido a la ausencia de un stock of biomass in native forests, the accuracy
inventario de las existencias de biomasa of the estimates from the losses associated
en los bosques nativos, la precisión de las with forest fires is very low.
estimaciones correspondientes a las pérdidas
asociadas a incendios forestales es muy baja. Conversions. As in the previous case there
is no inventory of the impacted surfaces,
Conversiones. Al igual que en el caso anterior so the estimates are very rough. It is worth
no existen inventarios de la superficie afectada, mentioning that the practice of conversion by
de manera que las estimaciones realizadas son the major companies has been discontinued
muy gruesas. Cabe mencionar al respecto que for a decade.
la práctica de sustitución ha sido erradicada
desde hace una década por parte de las The results of the study show that emissions
principales empresas. capture comes primarily from forestry
management, accounting for 66.4% of total
Los resultados obtenidos del estudio muestran capture (capture accounted for comes from
que la mayor parte de las capturas de emisiones forest management and abandonment of
corresponden al manejo forestal, conformando managed land).
un 66,4% de las capturas totales (las capturas
contabilizadas provienen de manejo forestal y On the other hand, the emissions accounted
abandono de suelo manejado). for come from fires and conversions, with fires
being the main emitters, contributing 82% of
Por otro lado, las emisiones contabilizadas total emissions in the subsector. Considering
provienen de incendios y conversiones, siendo both the capture and emissions a net total
los incendios los que emiten mayoritariamente capture of 42,379 million tons of CO2 is the
y constituyen el 82% de las emisiones totales result.
en el subsector. Considerando las capturas y
emisiones se obtiene una captura neta total de Below are the estimated 2005 emissions
42.379 millones de toneladas de CO2. for the Forestry and Land Use Change (LUC)
subsector compared to those in 1994. These
A continuación, se muestran las emisiones emissions have been modified with respect to
estimadas para el año 2005 para el subsector the First National Communication according
Forestal y Cambio de Uso de Suelo (CUS), las to the methodology used in that study, while
que se comparan con las del año 1994. Estas trying to correct the errors and inconsistencies
emisiones han sido modificadas respecto a detected there. It is evident that the figures
las de la Primera Comunicación Nacional, have not changed much in 11 years.
de acuerdo a la metodología usada en este
estudio e intentando corregir los errores e18
incongruencias detectadas. Se puede apreciar
que los valores no han variado mucho en 11
años.
Cuadro 2: Emisiones Subsector Forestal y Table 2: Forestry and Land Use Change
Cambio de Uso de Suelo: Subsector Emissions: Years 1994 and 2005
Año 1994 y 2005 (Gg CO2e) (Gg CO2e)
Actividades / Año / Activity / Year 1994 2005
Manejo Forestal / Forestry Management -35 375 -33 342
Abandono de suelo manejado / Abandonment of Managed Land -18 327 -16 861
Incendios / Fires 8 297 6 389
Conversiones / Conversions 2 870 1 435
Total / Total -41 570 -41 414
Fuente: Elaboración propia Source: Developed in-house
Procesos industriales. Las emisiones de Industrial Processes. The emissions from
procesos industriales consideradas en este industrial processes considered in this analysis
análisis son las de la producción de cemento y are those from the production of cement, and
de acero y hierro, que corresponden a las de steel and iron, as these are the most important
mayor importancia en la categoría. in the category.
Los resultados se obtienen utilizando la The results were obtained utilizing the PRIEN
metodología propuesta por PRIEN (2000). En (2000) methodology. The figure below
la siguiente figura se presenta la estimación presents the estimated emissions from
de emisiones de Procesos Industriales Industrial Processes (emissions from cement,
(considerando las emisiones de cemento, iron and steel). By 2006, there was a total of
y acero y hierro). Se alcanza un total de 4 4 million tons of CO2e, equivalent to a 1.7-fold
millones de toneladas de CO2e al año 2006, increase from 1986 (with an average growth of
lo que equivale a un incremento de 1,7 veces 5.3% over the period).
respecto al año 1986 (con un crecimiento
promedio de 5,3% en el período).19
Figura 2: Emisiones de GEI Procesos Figure 2: GHG Emissions From Industrial
Industriales (MTCO2e) Processes (MTCO2e)
4 500
4 000
GHG Emissions (Thousands T CO2e)
Emisiones GEI (Miles T CO2e)
3 500
3 000
2 500
2 000
1 500
1 000
500
0
1986
1987
1988
1989
1990
1991
1992
1993
1994
1995
1996
1997
1998
1999
2000
2001
2002
2003
2004
2005
2006
Años
Years
Acero y Hierro Cemento
Iron ans Steel Cement
Fuente: Elaboración propia. Source: Developed in-house
2.5 Inventario de Emisiones 2.5 Inventory of Total Annual
Totales: Año 2005 Emissions: 2005
A continuación, de acuerdo a los antecedentes The Emissions Inventory for 2005 was
estimados anteriormente, se elabora el developed using all of the previously
inventario de emisiones para el año 2005, established estimates and taking into account
considerando todos los sectores y categorías all of the corresponding sectors and categories.
correspondientes. Dado que este estudio no Because this study has not made estimates
ha realizado estimaciones de los sectores for the Agricultural and Waste Management
agricultura y manejo de desechos, se ha sectors, the 1994 figures were used, assuming
considerado utilizar los valores de 1994, bajo that any variations would be negligible relative
el supuesto que su variación es despreciable to other sectors.
en relación a la de otros sectores.20
Cuadro 3 : Emisiones Totales de GEI en Chile. Table 3 : Total GHG Emissions in Chile. 2005
Año 2005 (Miles T CO2e) (Thousands T CO2e)
Sectores / Sector
Combustión Fuentes Fijas / Stationary Sources Combustion 37 500
Combustión Fuentes Móviles / Mobile Sources Combustion 20 640
Procesos Industriales / Industrial Processes 3 649
Agricultura / Agriculture 10 144
Manejo de Desechos / Waste Management 1 138
Subtotal / Subtotal 73 071
Forestal y Cambio Uso Suelo / Forestry and Land Use Change
Manejo Forestal / Forestry Management -33 342
Abandono de suelo manejado / Abandonment Managed Land -16 861
Incendios / Fires 6 389
Conversiones / Conversions 1 435
Subtotal / Subtotal -42 379
TOTAL CHILE 30 692
Fuente: Elaboración propia. Source: Developed in-house
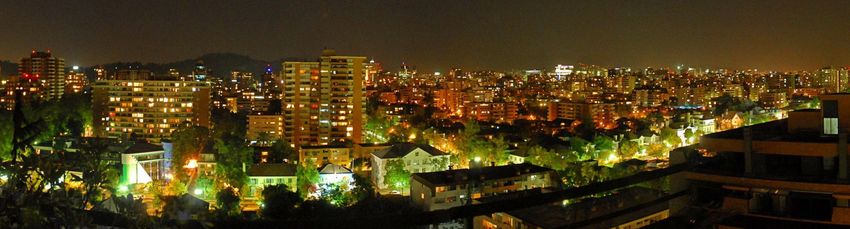
Se observa que las emisiones provenientes de Emissions from Stationary Sources make
fuentes fijas conforman la mayor parte de las up the bulk of total emissions (51% without
emisiones totales (el 51%, sin considerar CUS), including Land Use Change), while those from
mientras que las provenientes de procesos Industrial Processes and Waste Management
industriales y manejo de desechos contribuyen contribute a much smaller fraction.
con una fracción bastante menor.
If the Forestry and Land Use Change subsectors
Al introducir el subsector forestal y CUS se are included, there is a reduction of over 50%
produce una reducción de más del 50% de of total emissions thanks to the capture from
las emisiones totales, gracias a la captura forest management and abandonment of
proveniente de manejo forestal y abandono managed land. With these included there is
de suelo manejado. Con ello se obtiene una a net emission of 30.69 million tons of CO2e,
emisión neta de 30,69 millones de T CO2e, which is a 42% increase over net emissions in
un 42% superior a la emisión neta de 1994. El 1994. The following chart summarizes net GHG
siguiente gráfico resume las emisiones netas emissions in Chile through 2005, according to
de GEI en Chile al año 2005, según su fuente their source.
de generación.21
Figura 3: Emisiones de GEI en Chile. Año 2005 Figure 3: GHG Emissions in Chile. 2005
80 000
60 000
GHG Emissions (Thousands T CO2e)
40 000
Miles Ton CO2e
20 000
0
- 20 000
- 40 000
- 60 000
Abandonment of Managed Land
Energy Sector
Fixed Sources
Industrial Processes
Forestry Management
Agriculture
Waste Management
TOTAL WITHOUT LUC
CPR
Fires
TOTAL WITH LUC
Industrial and Mining
Transformation Centers
LUC and Forestry
Convensions
Agricultura
Conversiones
Centros de Transformación
Abandono de suelo manejado
TOTAL SIN CUS
CUS y forestal
Fuentes Fijas
CPR
Manejo Forestal
Incendios
TOTAL CON CUS
Industrial y Minero
Sector Energía
Mobile Sources (Transportation)
Manejo de Desechos
Fuentes Móviles (transporte)
Procesos Industriales
Fuente: Elaboración propia. Source: Developed in-house
2.6 Indicadores Asociados a las 2.6 Indicators Associated with
Emisiones de GEI en el Sector GHG Emissions in the Energy
Energía: 1990 – 2006 Sector: 1990 – 2006
En esta sección se realiza un análisis de la This section provides an analysis of how certain
evolución de algunos indicadores relacionados indicators related to energy consumption and
con el consumo de energía y las emisiones de CO2e emissions evolved from 1990 to 2006.
CO2e en el período 1990 – 2006.
First, the per capita energy consumption is
En primera instancia se revisan los consumos reviewed. The following figure shows this
de energía per cápita. En la figura siguiente se analysis for the period.
puede apreciar este análisis para el período
indicado.22
Del gráfico se puede inferir que Chile ha It can be inferred from the graph that Chile has
evolucionado desde un consumo de 12 GCal/ moved from consuming 12 Gcal/inhabitant
habitante, a cerca de 20 GCal/habitante. Vale to close to 20 Gcal/inhabitant. In other
decir, casi ha doblado su consumo per cápita words, Chile has nearly doubled its per capita
en los últimos 15 años. En particular, el sector consumption in the last 15 years, with the
Centros de Transformación es el más relevante Transformation Centers sector in particular
a partir del año 1998. becoming most relevant starting in 1998.
Figura 4: Consumo de Energía Per Cápita Figure 4: Energy Consumption Per Capita
1990-2006 (GCal/Habitante) 1990-2006 (GCal/Inhabitant)
22
Energy Consumption Per Capita (Gcal/inhab)
Consumo energía per cápita (Gcal/hab)
20
18
16
14
12
10
8
6
4
2
0
1990
1992
1994
1996
1998
2000
2002
2004
2006
Años
Years
Comercial, Público y Residencial Industrial y Minero Transporte Sector Energía Centros de Transformación Total
Commercial, Public and Industrial and Transportation Energy Sector Transformation Centers Total
Residential (CPR) Mining
Fuente: Elaboración propia. Source: Developed in-house
Finalmente, en la figura siguiente se presentan Finally, the following figure shows per capita
las emisiones per cápita, las que han emissions, which have risen by almost 70%
aumentado en casi un 70% entre 1990 y 2006. between 1990 and 2006. Based on this
Respecto a este indicador, el valor de Chile al indicator, Chile’s consumption in 2006 (3.9 T
2006 (3,9 T CO2e/hab), es superior al del resto CO2e/inhabitant), is above that of the rest of
de Latinoamérica, y es bastante más bajo que Latin America, and considerably below that of
los valores de países desarrollados revisados. the developed countries reviewed.23
Figura 5: Emisiones de GEI Per Cápita 1990- Figure 5: Per Capita GHG Emissions 1990-
2006 (T CO2e/Habitante) 2006 (T CO2e/Inhabitant)
4,0
Per Capita GHG Emissions (T CO2e/inhab)
Emisiones GEI per cápita (T CO2e/hab)
3,5
3,0
2,5
2,0
1,5
1,0
0,5
0,0
1990
1992
1994
1996
1998
2000
2002
2004
2006
Años
Comercial, Público y Residencial Industrial y Minero Transporte Sector Energía Centros de Transformación Total
Commercial, Public and Industrial and Transportation Energy Sector Transformation Centers Total
Residential (CPR) Mining
Fuente: Elaboración propia. Source: Developed in-house3 Proyección del Consumo Energético Sectorial y de las Emisiones Projections of Energy Consumption and Emissions by Sector
26

3.     Proyección del Consumo                     3      Projections of Energy
       Energético Sectorial                              Consumption and Emissions
       y de las Emisiones                                by Sector

En esta sección se lleva a cabo la proyección     This section includes the projections by sector
del consumo energético sectorial y de las         for energy consumption and GHG emissions
emisiones de gases de efecto invernadero en       in Chile. It includes a proposed projection on
Chile. Ello incluye una propuesta de proyección   the balance of captured and emitted gases
del balance de secuestro y emisiones del          for the Forestry and Land Use Change sectors,
sector forestal y Cambio de Uso de Suelo, las     emissions associated with Industrial processes
emisiones asociadas a Procesos Industriales       and emissions from the Energy sector, based
y las emisiones del Sector Energía, a partir      on an estimate of energy consumption per
de la estimación del consumo energético           sector and the corresponding level of GHG
sectorial y sus correspondientes emisiones        emissions. In the latter case, energy demand
de GEI. En este último caso, se estimaron las     was estimated for Electricity Generation and
demandas energéticas en Generación Eléctrica      Other Transformation Centers with their
y Otros Centros de Transformación y sus           corresponding associated emissions.
correspondientes emisiones asociadas.

3.1    Proyección del Balance de                  3.1    Projection of the Balance of
       Secuestro y Emisiones del                         Capture and Emissions for the
       Sector Forestal y Cambio de                       Forestry and Land Use Change
       Uso de Suelo                                      Sectors

El balance proyectado considera las emisiones     The projected balance included the emissions
y capturas por manejo de bosques y abandono       and captures from Forest Management and
de suelos y las emisiones por incendios y         Land Abandonment along with emissions
conversiones. Agregando los resultados            from Fires and Conversions. Aggregating these
anteriores y asumiendo como constantes las        results while assuming that other sources of
fuentes de otras emisiones (“urbanización”        emissions remain constant (urbanization and
y “combustión de residuos”), se obtiene el        waste combustion), the following balances are
balance de la figura siguiente.                   obtained.
27
Figura 6. Balance de Captura y Emisiones del Figure 6. Balance of Capture and Emissions
Sector Forestal y Cambio de Uso de Suelo from the Forestry and Land Use Change
(MM T CO2e) Sectors (Thousands of T CO2e)
60 000
44 000
28 000
Thousands T CO2e
12 000
Miles T CO2e
-4 000
-20 000
-36 000
-52 000
-68 000
-84 000
-100 000
1994
2000
2005
2010
2015
2020
Años
Years
Crecimiento plantaciones Cosecha bosques Abandono de suelos
Growth Plantations Forest Harvest Abandonment of Land
Emisiones por incendios Conversiones Balance Secuestro/Emisiones
Emissions Due to Fire Conversions Balance of Capture/Emissions
Fuente: Elaboración propia. Source: Developed in-house
Como se aprecia en el gráfico anterior, a partir The chart above shows that starting in 2010,
del 2010 el balance de secuestro/emisiones the balance of captures/emissions from the
del sector Forestal y CUS experimenta una Forestry and LUC sectors has a 16% reduction
reducción del 16% con respecto al valor del when compared to 1994, and the trend
año 1994, reducción que tiende a estabilizarse stabilizes starting in 2015 at around -27 million
partir del año 2015 en torno a -27 millones de tons of CO2e.
toneladas de CO2e.
The result obtained, coupled with the relative
El resultado obtenido, sumado a la scarcity of data available to make projections
relativamente escasa disponibilidad de for the Forestry and LUC sector, along with
datos para efectuar las proyecciones del the methodological differences between the
sector forestal y CUS, y a las diferencias projections for this sector and the Energy
metodológicas entre las proyecciones de sector led to the consideration of only Energy
este sector y del sector energía, llevan a emissions for the purposes of developing GHG
considerar en este estudio únicamente las projections in this study.
emisiones energéticas para el desarrollo de las
proyecciones de emisiones de GEI.28
3.2 Proyección de las Emisiones 3.2 Projection of GHG Emissions
de GEI Asociadas a Procesos Associated with Industrial
Industriales Processes
Las emisiones asociadas a procesos Emissions associated with industrial processes
industriales (cemento y acero y hierro) se (cement and steel and iron) are estimated
estiman utilizando la metodología presentada using the methodology presented above,
anteriormente, la que utiliza como base los which has as its basis the production values
valores de producción de estos insumos. of these inputs. In this way, and by using
De esta forma, y utilizando proyecciones production projections, the trend in emissions
de producción, se estima la evolución de for these sectors is estimated and presented in
las emisiones para estos sectores. Ellas se the following figure.
presentan en la siguiente figura.
Figura 7. Evolución de las Emisiones de GEI Figure 7. GHG Emissions Trend Associated
Asociadas a Procesos Industriales With Industrial Processes
(MM TCO2e) (Thousands T CO2e)
12 000
GHG Emissions ( Thousands T CO2e)
10 000
Emisiones GEI ( Miles T CO2e)
8 000
6 000
4 000
2 000
0
2007
2008
2009
2010
2011
2013
2014
2015
2016
2017
2018
2019
2020
2021
2022
2023
2024
2025
2026
2027
2028
2029
2030
Años
Years
Acero y Hierro Cemento
Steel Cement
Fuente: Elaboración propia. Source: Developed in-house
Como se aprecia en la figura anterior, las As shown in the figure above, emissions
emisiones de procesos industriales (cemento y from industrial processes (cement, steel and
acero y hierro) aumentan casi tres veces en el iron) increase almost threefold in the period,
período, alcanzando las 18.000 toneladas de reaching 18 million of CO2e in 2030.
CO2e el año 2030.29
3.3 Consumo Energético 3.3 Energy Consumption and
Sectorial y Emisiones de Emissions of GHG by Principal
GEI de Principales Sectores Energy Consuming Sectors:
Consumidores de Energía: 2007 – 2030
2007 – 2030
En esta sección se presenta la estimación de This section presents the estimated energy
los consumos energéticos de los principales consumption by the major fuel consuming
sectores consumidores de combustibles, para sectors, and then estimates the GHG emissions
posteriormente estimar las emisiones de GEI associated with this consumption. This has
asociadas a dichos consumos. Para ello, se ha been done using a methodology which
seguido una metodología mixta que mezcla el blends the use of econometric projections
uso de proyecciones econométricas respecto for energy consumption statistics in each
de las estadísticas de consumo energético sector, the estimated production projections
de cada sector, las proyecciones productivas from some important sectors, as well as
estimadas por algunos sectores importantes, secondary sources and expert opinion. From
además de información secundaria y opinión these various sources a baseline scenario was
experta. Ello, ha permitido construir el constructed to estimate the most probable
escenario base más probable de consumo level of energy consumption from the different
final de los distintos energéticos del país, de users in Chile, based on the productive sector
acuerdo al sector productivo y las emisiones and GHG emissions corresponding to each.
de GEI correspondientes a cada uno de ellos.
3.3.1 Metodología de Proyección de 3.3.1 Methodology for Projecting
Consumos Energéticos Energy Consumption
La metodología para proyectar los consumos The methodology for projecting 2007-2030
energéticos 2007 – 2030 emplea un enfoque energy consumption employs an econometric
econométrico que considera los sectores approach that disaggregates the different
económicos, según la desagregación del sectors from the Energy Balance published
balance de energía publicado anualmente por annually by the National Energy Commission.
la Comisión Nacional de Energía.
An approach was developed to show the long-
Se elaboró un enfoque que entregue las term trends for energy consumption, in the
tendencias de largo plazo para los distintos different sectors, as a function of the variables
consumos energéticos en los distintos sectores, affecting energy consumption in each sector
en función de las variables que afectan el or subsector. This is an appropriate approach,
consumo energético del sector o subsector given the available data, compared to other
respectivo. Este enfoque es más conveniente, approaches that require more intensive time
dado los datos disponibles, a otros enfoques series data. Those approaches also would not
que tienen requerimientos de series de allow for sensitivity analysis of the predictions
tiempo más intensivas. Además no permiten under different assumptions of change in
realizar sensibilidades en las predicciones bajo production levels.
diferentes supuestos de cambios en los niveles
de producción.También puede leer