A Study of The Active Galactic Nucleus
←
→
Transcripción del contenido de la página
Si su navegador no muestra la página correctamente, lea el contenido de la página a continuación
A Study of The Active Galactic Nucleus
  of NGC 4593 with Adaptive Optics
 Assisted Data from the Integral Field
         Spectrograph MUSE

TRABAJO DE FIN DE GRADO    Autora: Paula Sosa Guillén
Universidad de La Laguna   Tutor: Sébastien Comerón
Facultad de Fı́sica
Julio 2021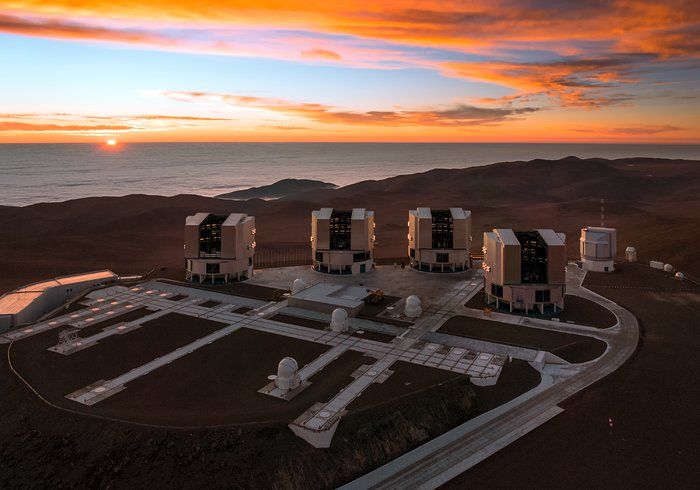
Contents

1 Resumen                                                                                                                                                       2

2 Introduction                                                                                                                                                  3
  2.1 Active Galactic Nuclei . . . . . . . . . .            .   .   .   .   .   .   .   .   .   .   .   .   .   .   .   .   .   .   .   .   .   .   .   .   .   3
       2.1.1 AGN types . . . . . . . . . . . .              .   .   .   .   .   .   .   .   .   .   .   .   .   .   .   .   .   .   .   .   .   .   .   .   .   3
       2.1.2 Unified Model of Seyfert Galaxies              .   .   .   .   .   .   .   .   .   .   .   .   .   .   .   .   .   .   .   .   .   .   .   .   .   4
  2.2 Stellar Kinematics in spiral galaxies . . .           .   .   .   .   .   .   .   .   .   .   .   .   .   .   .   .   .   .   .   .   .   .   .   .   .   5
       2.2.1 Sigma-Drop, σ-drop . . . . . . . .             .   .   .   .   .   .   .   .   .   .   .   .   .   .   .   .   .   .   .   .   .   .   .   .   .   6
  2.3 MUSE data . . . . . . . . . . . . . . . .             .   .   .   .   .   .   .   .   .   .   .   .   .   .   .   .   .   .   .   .   .   .   .   .   .   6
  2.4 NGC 4593 . . . . . . . . . . . . . . . . .            .   .   .   .   .   .   .   .   .   .   .   .   .   .   .   .   .   .   .   .   .   .   .   .   .   7
  2.5 Rotation curves in spiral galaxies . . . .            .   .   .   .   .   .   .   .   .   .   .   .   .   .   .   .   .   .   .   .   .   .   .   .   .   8

3 Objectives                                                                                                                                                    9

4 Methodology and Data Processing                                                                                                                               11
  4.1 Observation Strategies . . . . . .    .   .   .   .   .   .   .   .   .   .   .   .   .   .   .   .   .   .   .   .   .   .   .   .   .   .   .   .   .   11
  4.2 Data obtention . . . . . . . . . .    .   .   .   .   .   .   .   .   .   .   .   .   .   .   .   .   .   .   .   .   .   .   .   .   .   .   .   .   .   12
  4.3 Pre-Processing Phase . . . . . . .    .   .   .   .   .   .   .   .   .   .   .   .   .   .   .   .   .   .   .   .   .   .   .   .   .   .   .   .   .   13
  4.4 The GIST pipeline . . . . . . . .     .   .   .   .   .   .   .   .   .   .   .   .   .   .   .   .   .   .   .   .   .   .   .   .   .   .   .   .   .   13
  4.5 Voronoi Binning . . . . . . . . . .   .   .   .   .   .   .   .   .   .   .   .   .   .   .   .   .   .   .   .   .   .   .   .   .   .   .   .   .   .   14
  4.6 Stellar kinematics processing . . .   .   .   .   .   .   .   .   .   .   .   .   .   .   .   .   .   .   .   .   .   .   .   .   .   .   .   .   .   .   15
  4.7 DS9 Software . . . . . . . . . . .    .   .   .   .   .   .   .   .   .   .   .   .   .   .   .   .   .   .   .   .   .   .   .   .   .   .   .   .   .   16

5 Results                                                                                                                                                       17
  5.1 NGC 4593 Morphology . . . . .       . . .     .   .   .   .   .   .   .   .   .   .   .   .   .   .   .   .   .   .   .   .   .   .   .   .   .   .   .   17
      5.1.1 Galactic Bulge . . . . .      . . .     .   .   .   .   .   .   .   .   .   .   .   .   .   .   .   .   .   .   .   .   .   .   .   .   .   .   .   17
      5.1.2 Nuclear ring . . . . . . .    . . .     .   .   .   .   .   .   .   .   .   .   .   .   .   .   .   .   .   .   .   .   .   .   .   .   .   .   .   17
      5.1.3 Strong Bar . . . . . . .      . . .     .   .   .   .   .   .   .   .   .   .   .   .   .   .   .   .   .   .   .   .   .   .   .   .   .   .   .   17
      5.1.4 Treatment of errors . . .     . . .     .   .   .   .   .   .   .   .   .   .   .   .   .   .   .   .   .   .   .   .   .   .   .   .   .   .   .   18
      5.1.5 pPXF fits . . . . . . . .     . . .     .   .   .   .   .   .   .   .   .   .   .   .   .   .   .   .   .   .   .   .   .   .   .   .   .   .   .   18
  5.2 NGC 4593 surface brightness . .     . . .     .   .   .   .   .   .   .   .   .   .   .   .   .   .   .   .   .   .   .   .   .   .   .   .   .   .   .   21
  5.3 Rotation curves of NGC 4593 .       . . .     .   .   .   .   .   .   .   .   .   .   .   .   .   .   .   .   .   .   .   .   .   .   .   .   .   .   .   21
      5.3.1 NGC 4593 central region       mass      .   .   .   .   .   .   .   .   .   .   .   .   .   .   .   .   .   .   .   .   .   .   .   .   .   .   .   22

6 Conclusions                                                                                      24
  6.1 Technical features conclusions . . . . . . . . . . . . . . . . . . . . . . . . . . . . . . . 24
  6.2 NGC 4593 features conclusions . . . . . . . . . . . . . . . . . . . . . . . . . . . . . . 24

                                                        1
1     Resumen
   Los Núcleos Activos Galácticos son fenómenos altamente energéticos que se producen en la región
central de algunas galaxias masivas. Consisten en la acreción de materia hacia un agujero negro súper
masivo situado en la región central. Este fenómeno es crucial para entender la morfologı́a y evolución
de las galaxias. Existen muchos tipos de galaxias que tienen esta caracterı́stica. En concreto nos
interesan las tipo Seyfert 1 que se reconocen debido a la fuerte emisión en lineas espectrales anchas.
    En el trabajo que nos ocupa se estudia la región central de la galaxia NGC 4593, una galaxia de
tipo Seyfert 1. El cubo de datos usado para su estudio se toma con el espectrógrafo de campo integral
MUSE (instalado en el Very Large Telescope). Este instrumento permite acceder a una calidad muy
buena en la observación astronómica, en parte proporcionada por las cuatro estrellas de guı́a láser
que permiten corregir la turbulencia atmosférica, y a su gran campo de visión. NGC 4593 es una
galaxia tipo espiral caracterizada por tener dos anillos: uno interno (anillo nuclear) y otro mayor en
la zona mas externa de la galaxia. Además, muestra lineas de emisión muy anchas en las lineas Hβ,
Hγ y Fe ii.
    La metodologı́a usada para llevar a cabo el análisis se basa en el uso del software GIST, que nos
ha permitido realizar el tesselado Voronoi a partir de los pı́xeles recogidos en un cubo de datos que
ha pasado un pre-procesado. Una vez se hace el tesselado Voronoi es posible proceder con el estudio
de la cinemática estelar con el programa pPXF. A partir del cual se obtiene el comportamiento de
las estrellas y se obtienen los mapas de velocidades. Para lograr un buen ajuste de los espectros se
han enmascarado las lineas de emisión de la zona central y las longitudes de onda asociadas al láser
utilizado por el telescopio. Ası́, se han podido obtener unos buenos resultados de la cinemática.
    Con los datos recogidos por este estudio se ha estudiado la cinemática y la morfologı́a de la región
central de la galaxia comprendida en el campo de visión (4.00 5 × 4.00 5). Se han expuesto los mapas
de velocidades y se han tratado debidamente. Además, se ha estudiado la imagen de la galaxia,
obtenida a partir del cubo de datos, con el software DS9 permitiéndonos hacer un estudio del brillo
superficial. En última instancia se ha hecho, con un código de python, un graficado de la curva de
rotación de la región interna de NGC 4593.
    Finalmente, se han extraı́do conclusiones con respecto a los resultados obtenidos durante el tra-
bajo. En estos, se recogen los aspectos más relevantes tanto de las técnicas de análisis de datos como
de la morfologı́a que presenta NGC 4593.
    De esta forma el trabajo está estructurado en diferentes bloques en base a lo anteriormente
comentado: una introducción para situarnos en el contexto teórico de lo que se trata, los objetivos
que se abordan en el trabajo, la metodologı́a aplicada para la obtención de resultados (la lı́nea de
trabajo que se ha seguido y los programas usados), los resultados junto con la discusión de estos y,
por último, la conclusión del trabajo.

                                                    2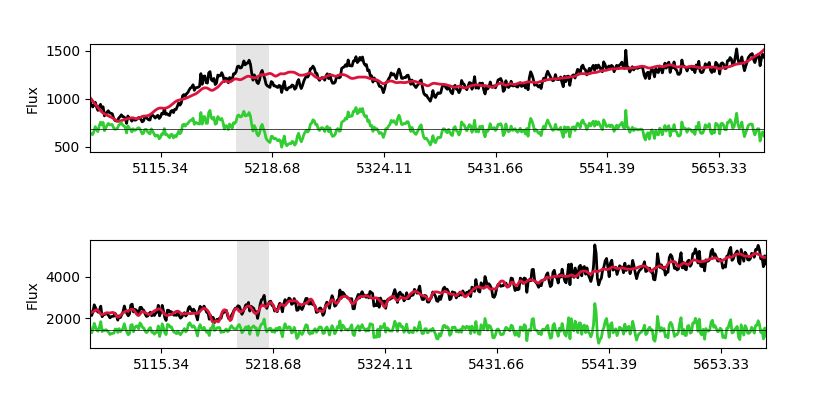
2     Introduction
                                                  Abstract

           En esta sección se presenta el contexto, desde un punto de vista teórico, de los aspectos que
      se estudian en el trabajo. En primer lugar, se introduce el concepto de núcleo activo galáctico
      ası́ como se enumeran y explican algunos de los diferentes tipos que se conocen. Además, se
      enfatizan las galaxias tipo Seyfert, que es el grupo al que pertenece la galaxia en cuestión de
      estudio: NGC 4593. Adicionalmente, se explican conceptos de la cinemática estelar, enfatizando
      en conceptos como el sigma-drop. A continuación, se presenta MUSE, un instrumento de última
      generación de alta resolución integrado en el Very Large Telescope, en Chile, y a partir del cual
      se han obtenido los datos de estudio. Además, se hace un repaso de las caracterı́sticas de
      la galaxia NGC 4593 que se conocen hasta la fecha. Por último, esta sección cuenta con un
      apartado dedicado a las curvas de rotación en galaxias espirales, puesto que en el estudio que
      hacemos se trabajará con este concepto.

2.1    Active Galactic Nuclei                              between the BH mass and the velocity dispersion
                                                           of the ionised gas [Ferrarese and Merritt, 2000].
   Active galactic nuclei (AGN hereafter) are of-
                                                           2.1.1   AGN types
ten found at the centre of massive spiral, ellip-
tical, and S0 galaxies. AGN are intense ener-                 According to their luminosities and spectral
getic phenomena which occur in the innermost               properties, the AGN can be subdivided into dif-
part of a galaxy. The brightness of AGN is very            ferent types, some of them are: Quasars, Radio
high and it is not associated with any radiation           galaxies, LINERs, Blazars, and Seyfert Galaxies.
emanating from star formation. It comprehends                  Quasars. Also known as Quasi-Stellar Ob-
a luminosity ranging from 1042 to 1048 erg s−1             jects, they are the brightest AGN type. Their
[Troncoso, 2009].                                          luminosity is usually about a thousand times
    AGN are a manifestation of the accretion of            greater than that of their entire host galaxy.
matter into a Super Massive Black Hole (SMBH               Therefore, it is often difficult to detect the un-
hereafter). Due to the angular momentum of the             derlying galaxy, and we can only see their nu-
infalling material, this process occurs through in-        cleus emission, hence, we merely have a few host
wards spiralling within an accretion disk. This            galaxies well defined, those that are close enough
accretion is a fundamental part of our knowl-              to be observed [Ramos Almeida, 2009]. Whereas
edge of galaxies since it affects the host galaxy          quasars themselves are easy to detect due to the
through feedback, allowing us to understand                high luminosity emitted. Different studies have
their evolution and the different phenomenolo-             shown that quasars were more active in the past.
gies that they present. As science has pro-                For instance, Schmidt et al. [1995] date the peak
gressed, close links have been established be-             of the quasar activity around 2.5×10⁹ years after
tween AGN, the host galaxy and the central                 the Big Bang. Also, some studies have revealed
SMBH. For example, a tight relation can be seen            that the gas around AGN is metal-rich, reinforc-

                                                       3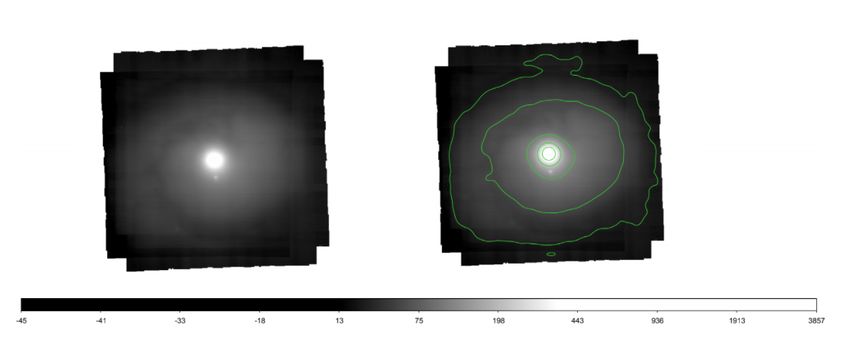
ing the concept of quasar formation early in the               known because of their intense emission in spec-
history of the universe.                                       tral lines. Also, they have a bright nucleus that
    Radio Galaxies. These galaxies are very lu-                can be observed in a huge spectral range (from
minous at radio wavelengths. This is due to syn-               radio to X-rays). In 1943, Carl Seyfert estab-
chrotron processes 1 that occurs at the galactic               lished a categorisation for the brightness of the
centre [Burbidge, 1956]. Radio wavelengths can                 central regions of galaxies, making it possible the
be detected at large distances, and hence, these               classification of the Seyfert Galaxies in several
galaxies are a useful tool in cosmology. The most              sub-types.
intense radio galaxies are large elliptical galax-
ies, and they can be sub-dived into two different
                                                               2.1.2    Unified Model of Seyfert Galaxies
types depending on their optical spectrum: the
broad-line radio galaxies and the narrow-line ra-                 There are two types of Seyfert galaxies:
dio galaxies.                                                  Seyfert 1 and 2 (Sy 1 and Sy 2, hereafter). In
    LINERs.        The Low-ionisation Nuclear                  the Sy 1 case, the spectrum is characterised by
Emission-line Region are the lowest luminos-                   broad emission lines (as for example in Hβ, Hγ,
ity type of AGNs. They are characterised by                    and Hα [Osterbrock, 1977]) and a deep contin-
an optical spectrum chiefly dominated by emis-                 uum stellar emission, while Sy 2 galaxies do not
sion lines from low ionisation atoms, as well as               show broad lines, having instead a low intensity
by deep absorption of stellar bands [Heckman,                  continuum [Ramos Almeida, 2009], as we can see
1980]. LINERs are the main AGN type found in                   in Figure 1. The broad and the narrow lines are
spiral galaxies.                                               generated in different regions of the innermost
    Blazars are AGN similar to Seyfert or                      galactic disc. The narrow lines are produced by
quasars galaxies. However, they are charac-                    low-density ionised gas: the Narrow Line Region
terised by the line of sight to the central engine:            (NLR hereafter), and the broad lines are pro-
Blazars have the jet (located at the centre of                 duced by high-density optically thick ionised gas:
the galaxy) pointing towards the observer [Urry                the Broad Line Region (BLR hereafter). The
and Padovani, 1995]. Through this, they mask                   BLR is much closer to the centre of AGN than
the absorption and emission of the optical spec-               the NLR [Ramos et al., 2009].
tral lines. Blazars are highly variable radio and                  After many studies, a Unified Model has been
gamma-ray sources, with quick fluctuations with                established [Antonucci, 1993]. The model posits
periods of days or hours.                                      that the difference between Sy 1 and Sy 2 AGN is
    In this paper, I am studying NGC 4593, a                   an orientation effect, being both different views
Seyfert 1 galaxy. Seyfert Galaxies are well                    of the same object as we can see in Figure 2.
  1
      Synchrotron radiation: It is electromagnetic radiation produced by charged particles that are accelerated.

                                                           4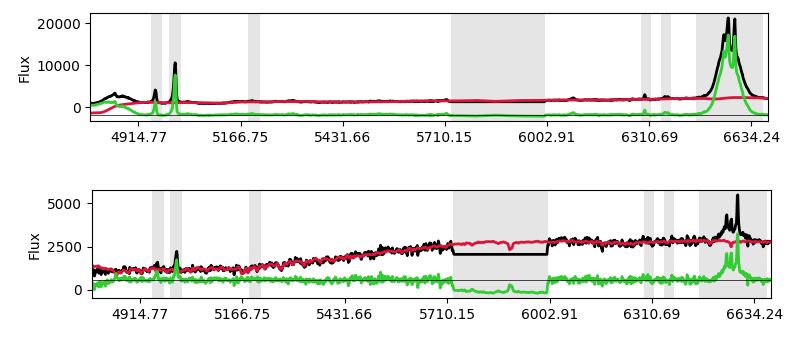
Figure 1: Spectra of the two chief types of Seyfert galaxies. Left Panel : A Seyfert 2 galaxy, NGC 7314.
Right panel : A Seyfert 1 galaxy, Arakelian 120. Notice how the emission lines for the Sy 1 are wider
than that for Sy 2. Figure taken from Winkler [1992].

    Sy 1s have a direct line of sight fixed to the       2.2    Stellar Kinematics in spiral
nucleus, allowing us to see the innermost parts of
                                                                galaxies
the galaxy, where the broad lines are generated,
whereas Sy 2s present an obscuration of these               We are going to study two different concepts
lines due to dust, distributed in a doughnut-            related to the Line Of Sight Velocity Distribu-
shaped torus [Ricci et al., 2011]. Further sub-          tion (LOSVD hereafter), which are the velocity
divisions of Sy galaxies exist, depending on the         and the velocity dispersion.
orientation of the AGN: these result in different            On one hand, the velocity, V? , is understood
optical spectra. These objects have been classi-         as the average velocity of the stars in each bin.
fied as type 1.2, 1.5, 1.6, 1.7, or 1.8.                 The galaxy has a relative motion away from us
                                                         (as observers), due to the expansion of the uni-
                                                         verse and the rotational movement of the object.
                                                         Each bin has a slightly different velocity from the
                                                         global motion of the galaxy.
                                                             On the other hand, we work with the velocity
                                                         dispersion, σ? . Each bin has an average speed,
                                                         however, the stars included in a specific bin do
                                                         not have the same velocity as they can move
                                                         away from this average. Therefore, the veloc-
                                                         ity dispersion describes the standard deviation
                                                         of the velocity of the stars in that bin. This has
                                                         direct consequences on the galaxy’s morphology.
                                                         If we have a low σ? compared with the circular
Figure 2: Schematic view of the Unified Model            velocity of rotation, the galaxy will have a disc,
of AGN. On the right side, we can observe the            whereas, if σ? is high, the galaxies do have a large
line of sight differences between Sy 1 and Sy 2          random motion and do not present a clear disc
galaxies. Taken from Tello [2014].                       morphology [Girardi et al., 1993].

                                                     5
2.2.1 Sigma-Drop, σ-drop 2.3 MUSE data
To observe and obtain information about
many different astronomical objects, the Eu-
ropean Southern Observatory (ESO) has de-
The σ-drop phenomenon is known as a dip veloped The Multi-Unit Spectroscopic Explorer
in the velocity dispersion. It seems intuitive (MUSE), an instrument integrated into the Very
that the velocity dispersion increases in the cen- Large Telescope (VLT) in the Atacama Desert,
tral region of a galaxy due to the presence of a in northern Chile (see Figure 3). The data of
slowly-rotating bulge and a SMBH. However, of- NGC 4593 used in this paper were obtained with
ten a low-velocity dispersion region is found at MUSE.
the centre of spiral galaxies.
In Comerón et al. [2008] and in Wozniak et al.
[2003] they suggest that σ-drop phenomenon are
caused by a recent star formation process.
Stars are born into a circumnuclear rotating
disk of cool gas. The gas and dust are stoked, in-
creasing the density until they collapse and star
formation begins.
The gas clouds cannot get velocity in the
vertical direction due to the viscosity: they are
continuously colliding. However, the stars are
point sources that do not collide with each other,
Figure 3: The Cerro Paranal hosting the Unit
hence, they can reach a considerable vertical ve- Telescopes of the Very Large Telescope. Figure
locity (due to gravitational effects that generate taken from the ESO Images.
a “kinematical heating”), making their σ to in-
crease. MUSE is an integral field spectrograph oper-
Star formation begins from flat disks and ating in the visible and near-infrared wavelength
with time the disk gains thickness, passing from range (4750 Å - 9300 Å), with a wide Field Of
less than a hundred parsecs in thickness, at the View (FOV hereafter) compared to others in-
beginning, to kiloparsecs at old ages. That hap- tegral field spectrographs. Also, it is equipped
pens because the newly-born stars have inherited with an adaptive optics (AO hereafter) system
the kinematics of a dinamically cold gas disc. known as GALACSI that can provide a signif-
A σ-drop due to star formation is a long-lived icant performance boost on the MUSE angular
phenomenon. When the star formation falls, the resolution [Bacon et al., 2010]. This system uses
velocity dispersion takes time, from hundreds of four sodium Laser Guide-Stars (Na-LGS) sent
Myr to Gyr [Comerón et al., 2008], to increase. from one of the Telescope Units of the VLT. The
Often we relate σ-drops with nuclear rings light emitted by these lasers is then collected
because they usually host huge star formation by four Wave Front Sensors (WFS) which are
regions. connected to a Real-Time Computer, SPARTA,
6which estimates the distortion introduced by the 2020].
Earth’s atmosphere, and calculates the correc-
tion that must be applied to obtain sharp data
[Stuik et al., 2006].
MUSE splits the FOV into 24 sub-fields,
each one fed into a spectrograph, called Inte-
gral Field Unit (IFU hereafter), producing a spa-
tially resolved spectrum. MUSE has two differ-
ent modes. On one hand, it has the Wide Field
Mode (WFM) with a FOV of 10 × 10 and, on the Figure 4: Image optical taken at the du Pont
other hand, the Narrow Field Mode (NFM) with telescope of NGC 4593.
a FOV of 7.00 5 × 7.00 5, being the one that uses the
Na-LGS AO [Bacon et al., 2010]. Thanks to the
NFM of MUSE, we can analyse the centre of
As we can extract from Comerón et al. [2010],
NGC 4593 in detail.
the nuclear ring presented by the galaxy is a star-
forming nuclear ring that has a relative size of
0.070 (ring diameter divided by Do , defined in
2.4 NGC 4593
Bottinelli et al. [1995] as the angular diameter
NGC 4593 is an AGN galaxy that is also size of the galactic disc), with a semimajor axis
known as MRK 1330 or MCG -01-32-032. Its of 880 pc.
position is right ascension RA = 12h 39m 39s , and This galaxy has been ambiguous concerning
declination δ = −0.5◦ 200 39.00 34 2 . the activity type as it is close to the boundary
This galaxy is classified as (R)SB(rs)b by between a Seyfert 1 and a Seyfert 1.2 [Davies
De Vaucouleurs et al. [2013] and Buta et al. et al., 2015], due to the strong broad Hβ com-
[2015]. It has a flattened disk with a pronounced ponent presented comparing to a Sy 1 galaxy
bar (of 10.3 kpc in length [Comerón et al., 2010]) [Osterbrock, 1977]. Nevertheless, we will con-
and a two-armed spiral structure with a cen- sider NGC 4593 as a Sy 1 [Marı́n et al., 2007].
tral galactic bulge. This bulge is important in It shows bright broad emission lines in Hβ, Hγ,
NGC 4593 because it host a bright compact nu- and Fe ii [Cackett et al., 2018].
cleus [Davies et al., 2015]. Additionally, it has NGC 4593 has a redshift of z = 0.00900
many tightly wound spiral arms with two rings: [Torricelli-Ciamponi et al., 2014], with a dis-
one innermost faint ring (a nuclear ring) and an tance of D = 35.35 ± 0.50 Mpc [Makarov et al.,
enormous outer ring around the outskirts of the 2014]. The diameter of NGC 4593 is of 39.25 kpc
galaxy (of 3.54 arcmin in projected major axis [Davies et al., 2015]. Also, it has a central
diameter [Comerón et al., 2014]) as we can see BH that has been studied by different scientists,
in Figure 4. Furthermore, the strong bar, present mainly in the X-ray range. They concluded that
in this galaxy, drives gas inwards, affecting the the logarithm of the BH mass, in solar mass units
motion of stars and their distribution [Kim et al., is MBH = 7.0 [Torricelli-Ciamponi et al., 2014].
2
https://ned.ipac.caltech.edu/
72.5 Rotation curves in spiral the radius of the galaxy from the centre.
Hence, the theoretical behaviour of the rota-
galaxies
tional curve will present a Keplerian fall outside
The rotational curve of a spiral galaxy is the the radius where the disc starts to fade out, with
rotational velocity of the observable material V ∼ 1/R1/2 . However, many studies such as
(stars, gas, and dust) as a function of the ra- Begeman et al. [1991], Sofue and Rubin [2001]
dial distance from the galaxy’s centre. This rep- or Salucci and Frenk [1989] show that rotation
resentation has been used by astronomers as a curves do not decay. As we can see in Figure 5
method to calculate the mass of the galaxy. If the curve does not fall, it remains constant at
we consider a spherical model for the galaxy, we a certain value of V as R increases. While R
obtain the relation [Lequeux, 1983]: grows, V is constant at ∼ 200 − 300 Km s−1 in
large spiral galaxies [Burbidge, 1975].
GM (R) The flat behaviour in the rotational curves
V2 = (1)
R has been explained as a mass effect. The most
Where V is the rotational velocity of the observ- extended theory support that spiral galaxies are
able material, G the constant of the gravitation, surrounded by a massive halo of dark matter, in
M is the mass inside a spheric radius, and R is which M (R) ∝ R.
Figure 5: Rotational curve of NGC 6503 taken from Begeman et al. [1991].
83 Objectives
Abstract
El objetivo principal de este Trabajo de Fin de Grado es el de conocer y utilizar diferentes
herramientas técnicas que se utilizan profesionalmente en la espectroscopia de campo integral
actual. Se utiliza el paquete de tratamiento de datos GIST, incluyendo las técnicas de tesleado
Voronoi, la obtención de mapas de velocidades de las estrellas con pPXF y el uso del software
DS9. He trabajado desde el sistema operativo Linux, familiarizándome con este y aprendiendo
a usar la lı́nea de comandos integrada.
Para lograr este objetivo se ha estudiado el centro de la galaxia NGC 4593, en el cual se
encuentra un núcleo activo galáctico de tipo Syfert 1. A partir de los datos recolectados con el
instrumento MUSE, se ha podido llevar a cabo esta tarea.
Este trabajo incluye también el objetivo de la ampliación del conocimiento teórico sobre
los núcleos activos galácticos. Además de permitirme acercarme, desde un punto de vista
instrumental y observacional, al mundo de la astronomı́a.
The main objective of this work is to learn I also have the objective of studying specific
and use different tools used in integral characteristics from NGC 4593, through reading
field spectroscopy. We have used the data previous studies and with my results. We anal-
processing package GIST, which includes the ysed different aspects from in the central region
Voronoi Tesselation method and the obtention of of the galaxy and worked with concepts as the
stellar velocity maps with pPXF. Also, I started superficial brightness and the rotational velocity.
to learn to use the DS9 software. To reach Another objective of this work was to apply
this objective, I had to use the operative system different concepts of astronomy, such as the tech-
Linux, where I have download all the software nical terminology and the distance units used in
required to develop the work. Through the anal- the field of galactic studies.
ysis of the central region of NGC 4593, we could My thesis has a format, in some aspects, sim-
use all the technical tools specified above. This ilar to a scientific article. Therefore, as an ob-
has trained me to process data cubes and I could jective, I have improved the use of LATEX, the
apply the knowledge acquired with NGC 4593 to technical English, and above all, I have read pa-
other galaxies. pers and learnt physics through them.
This galaxy, being a Seyfert 1, hosts an ac- From an academic point of view, my objec-
tive galactic nucleus. Hence, this work also has tive was the application of physics in a research
the objective of extending my theoretical knowl- environment. I have seen how the workplace
edge on the field of active galaxies. All the data could be and learned from people such as my
used have been taken by the MUSE instrument, tutor, that is integrated into the research com-
therefore, I could work with real data and make munity. I have learned about the interpretation
a consistent data processing. of scientific data, the communication of prob-
9lems, ideas, and solutions.
As a personal objective, I could know if I re-
ally feel comfortable with this field of study. I
used this opportunity to choose a possible way
to dedicate myself professionally in the future.
104 Methodology and Data Processing
Abstract
Para el estudio y tratamiento de datos de NGC 4593 se han tenido en cuenta varios aspectos
que son contemplados en esta sección. En primer lugar se citan y explican algunas de las
estrategias de observación que se deben tener en cuenta a la hora de recoger datos con un
telescopio (bias, corriente oscura, flat field, etc). A continuación, se recoge brevemente cómo
ha sido la obtención de datos, considerando el tiempo de exposición y la secuencia de cielo-
objeto durante la observación. También se explica, a grandes rasgos, la estructura de la fase de
pre-procesamiento que siguen los datos del instrumento MUSE. Se enfatiza en el GIST pipeline
software que se ha usado en el tratamiento de datos, considerando los aspectos que se han
utilizado: el análisis de la cinemática estelar y el Teselado Voronoi. A este último se le ha
dedicado una sección en la que se explica qué es y en qué consiste el método de teselado.
Adicionalmente, se indica cómo y con qué condiciones se estudia la cinemática estelar. Por
último, se hace una breve mención al software de astronomı́a DS9 que se utiliza durante el
análisis de datos.
To study and analyse the central region of read-out noise of the CCD.
NGC 4593 we use a data cube obtained from the
To make this possible, we have to take
ESO archive. It offers science-ready data known
some images with zero exposition time and
as ‘Phase 3’ data. These data have been pre-
with the shutter closed. Then, we obtain
processed by ESO through the MUSE pipeline.
the average/ median/ resistant mean bias.
Each telescope pointing, returns a 3D final data
cube (with two spatial and one spectral coordi-
nate) and another one containing the error. BIAS = bias (2)
BIAS ≡ Master bias. bias ≡ Average/ median/
4.1 Observation Strategies resistant mean of individual bias frames.
During the pre-processing phase the astro-
• Dark current: The temperature induces a
nomical data are calibrated to obtain a data
thermal noise in the CCD that turns into a
cube with science-ready quality. The different
signal: the dark current. To eliminate this
steps that take place in the pipeline are aimed
effect it is necessary to take images (with
at, among others things, taking the following fac-
the shutter closed) with an exposure time
tors into account.
comparable to the science data exposures.
• Bias: To avoid pixels with zero or negative
count values that could be problematic for
darks − BIAS
DARK = (3)
the data processing, the CCD is preset to tdarks
a roughly constant base number of counts. DARK ≡ Master dark. darks ≡ Individual darks
The bias frames are also able to correct the frames. tdarks ≡ Dark time exposure.
11• Flat field: As a result of the geometrical multiplicative factor that gives an account on the
distribution of the CCD panels, not all the atmospheric absorption.
pixels have the same sensitivity. This hap- Working on a data cube (that is the case of
pens, among other reasons, because of the the topic in this paper) which has a spectral di-
dimensional differences of the optical path. mension, it is recommendable to also calibrate
Each pixel can return a different value from that aspect. Each pixel has a specific wave-
the same luminosity source, presenting dif- length. So, the camera has to point to a cali-
ferent sensitivities. bration lamp that shows a set of known spectral
To correct this, the telescope has to point lines to analyse the wavelength corresponding to
during the twilight to a place where there each pixel. This depends a lot on the tempera-
are no bright stars, and take some frames ture, that is why the calibration has to be done
of a few seconds to characterise the flat just before (or just after) as the observations.
field. During the observation of a galaxy the sky
has an emission. Sometimes, and especially in
infrared, the sky can be brighter than the ob-
FLAT = N(flat − BIAS − DARK · tflat ) (4) ject observed. To solve this problem, the as-
tronomers have to take images from the sky away
FLAT ≡ Master flat. flat ≡ Individual flat frames.
from the target and subtract its contribution to
tflat ≡ Flat time exposure. N ≡ Normalisation
the object image. Due to the quick changes in
constant.
the sky, it becomes necessary to make sequences
of observation of the sky and the object during
Considering these three aspects, it is possible the data collection.
to have a final image, corrected from the above
presented instrumental effects:
4.2 Data obtention
image − BIAS − DARK · timage The data obtained to study the central re-
IMAGE = (5)
FLAT
gion of NGC 4593 were taken during the night
IMAGE ≡ Combined data. image ≡ Individual data of April 20, 2019 with Jahnke Knud as prin-
frames. timage ≡ Image time exposure. cipal investigator. With the MUSE-NFM AO,
8 × 600 s on-target exposures intertwined with
2 × 200 s off-target exposure of the sky were col-
At this point, the flux calibration has to be lected. The sequence was: object - object - sky
considered. Due to some factors, such as the - object - object - object - object - sky - object
state of the atmosphere or the quality of the tele- - object. Fortunately, all exposures were taken
scope, the data obtained can have many lost pho- with enough angular resolution and quality to be
tons, affecting the estimated luminosities. So, used.
the idea is to take images of a known star and The raw data were pre-processed with the
compare the observed luminosity with the real MUSE pipeline and also have experienced
luminosity. With this process we can extract a Voronoi Binning. Now, because more than a
12year has passed since the data acquisition, we bined data cube and a combined IMAGE FOV.
can freely access the data in the ESO archive. At this point, we have all information ready for
scientific analysis [Weilbacher et al., 2020].
4.3 Pre-Processing Phase
The data reduction follows different steps,
done by the ESO MUSE data reduction pipeline.
First, the raw files are pre-processed with the
recipe muse scibasic, able to convert the pixels
of the CCD into a table (dividing geometrically
the field of view and adjusting the wavelength as-
sociated with each pixel). This recipe also takes
into account the bias and the flat-fielding.
Second, the blank sky observations, taken
during the data obtention, are also processed
with the recipe muse create sky to generate
two different files: the sky line emission and the
sky continuum spectrum.
Next, the object files are processed again,
Figure 6: Illustration of the Data Cube Analysis
now, using the sky information with the recipe taken from the ESO Phase 3 Data Release De-
muse scipost, capable of subtracting the sky scription.
contamination and correcting the exposure from
the atmospheric refraction. Finally the data are To sum up, if our data set has [N] object ex-
resampled into a data cube. posures and [M] sky exposures, the output will
At this point, we obtain for each data cube, be one combined data cube of the object ob-
two files: IMAGE FOV (a 2D image of the FOV, served and another one, also combined, from the
obtained by collapsing the data cube along its sky files, plus two IMAGE FOVs corresponding
spectral axis) and a PIXEL TABLE (which con- to each data cube. The data cubes have two ex-
tains the information required to build the data tensions, one with the signal and other with the
cube but stores the coordinates of each pixel in estimated uncertainties. In the Figure 6 we can
a table). Then, the IMAGE FOV files, for each see a visual representation of the process.
pointing, are processed with muse exp align. The data obtained from the ESO archive
This recipe estimates the shift that are required that I have used to make this study has already
to align the data cubes. passed this pre-processing phase.
Finally, the PIXEL TABLE files are pro-
cessed too with muse exp combine, which is in
4.4 The GIST pipeline
charge of applying the alignment correction and
resampling the data cubes. Therefore, the result The pre-processed data cube has been pro-
of MUSE pipeline process gives back the com- cessed through the Galaxy IFU Spectroscopy
13Tool (GIST), an all-in-one software able to con- 4.5 Voronoi Binning
duct a complex analysis of data cubes [Bittner
et al., 2019]. GIST is entirely written in Python 3 Voronoi Binning is a processing data technique
and it let us extract the stellar kinematics, anal- able to produce an adaptative spatial binning to
yse the emission-lines, and show stellar popula- obtain bins with a desired Signal-to-Noise ratio
tion properties from the spectrum. This software (S/N hereafter), providing the maximum possi-
is extremely useful and versatile due to the easily ble angular resolution in 2D. As we have al-
modifiable code architecture presented. Further- ready seen, when the data have passed through
more, GIST can work in many different settings, Phase 3, we obtain a data cube with two exten-
making it a perfect tool to use with MUSE. sions. One with the signal, and the other one
The code is structured in three different with the estimated uncertainty.
parts: the preparatory steps; the main anal- It is possible to calculate the S/N ratio in a
ysis, that extract information about many as- bin formed by n pixels:
pects; and the visualization [Bittner et al., Pn
S Si
2019]. = pPi=1
n (6)
N 2
i=1 σi
We are interested in two main aspects:
• Voronoi Binning of the cube, where we Where Si is the signal associated to each pixel i
can choose the Signal-to-Noise ratio of the and σi corresponds to the uncertainty.
spectra with which we want to work with. To work with astronomical objects it is often
This is implemented during the prepara- necessary to locally average the data together
tory step. to do a good scientific analysis. The Voronoi
Binning technique, named as Voronoi Tessela-
• The stellar Kinematics analysis: GIST tion (VT hereafter), allows us to have a roughly
uses the pPXF routine, that is widely ex- constant S/N value in each bin. Indeed, bigger
plained in Cappellari and Emsellem [2004]. bins will appear in the low S/N regions and the
pPXF allows us to have a stellar spectrum smaller ones will be in the high S/N regions (giv-
fitted with a lineal combination of stellar ing more resolution).
templates with different ages and chemical We work with the code written by Cappel-
compositions which are shifted and broad- lari and Copin [2003] within GIST to produce a
ened to take into account the kinematics Voronoi Binning. The technique has to satisfy
on the line of sight velocity distribution. some aspects: The bins generated by the code
This software includes a visualization rou- have not overlapping spaxels or holes in the fi-
tine called Mapviewer, which is a sophisticated nal data. The shape of the bins has to be com-
graphical user interface. It has been made specif- pact (as round as possible). And, the number
ically to show all data processed by this pipeline, of bins presented in our data has to be as small
where we can see all the properties (as the spec- as possible, but without sacrificing the spatial
trum, kinematics fits or stellar population fits) resolution. These three aspects are known as
of each Voronoi bin by simply clicking on it in a topological, morphological, and uniformity
map of the FOV. requirement respectively.
14Figure 7: Example of Voronoi Binning. Figure from Cappellari [2009]. Left Panel : CVT binning
method from an image with 350000 pixels, gathered into 3000 bins. Right panel : S/N Scatter from
the CVT method above. In red S/N of the original pixels, in black the (S/N)bin of each bin. The
target is (S/N)T = 20.
To satisfy all requirements, the VT applies tions spectra with different metallicities and
the called Centroidal Voronoi Tessellation (CVT ages, called stellar population templates [Falcón-
hereafter) method, which can generate a tailored Barroso et al., 2011]. In the spectral range of in-
distribution of pixels into bins. Through some terest, MILES has a spectral resolution of 2.51Å
computational developments based on the Lloyd in FWHM [Beifiori et al., 2011].
method (1982), Cappellari and Copin could cre- In our study of the kinematics, we work with
ate a system able to bin the scientific data to be a wavelength range of 4800 Å - 6690 Å. We
then analysed, as we can see in Figure 7. could not work with a wider spectrum because
Spatial Binning is crucial for the study of my laptop did not have enough RAM. We have
stellar kinematics, the topic in this paper. All not considered the regions redder than 7000Å
the bins in the extraction of kinematics require due to the presence of prominent sky lines, bring-
to have a similar S/N, so the properties esti- ing noise to the final data.
mated for each of them are comparable. Some spectral emission lines have to be
We have binned the data with a signal-to- masked for running pPXF. The wavelength
noise ratio of 25 in the wavelength range 5400 − range associated with the AO corrections, which
5600Å. include 5780Å to 6050Å, is affected by the laser
guide of the AO. Also, some galaxy emission
4.6 Stellar kinematics processing lines with prominent peaks have been masked
with a width of 30Å, and we have additionally
Through GIST, using pPXF, we can fit the masked the contribution of the Hβ line with a
velocity V? and the velocity dispersion σ? (ex- mask 120Å in width and the [N ii] with a mask
plained in Section 2.2). We have also used 180Å in width. The masked lines are shown in
MILES, that is a library of stellar popula- Table 1.
15Line Wavelength [Å] Width [Å]
Hβ 4861.32 120
[O iii] 4958.83 30
[O iii] 5002.77 30
[N i] 5200.39 30
[O i] 6300.20 30
[O i] 6363.67 30
[N ii] 6547.96 180
Hα 6562.80 30
[N ii] 6583.34 30
Table 1: Emission lines masked for the analysis of stellar kinematics.
4.7 DS9 Software We have used this software to further analyse
our NGC 4593 data. We have learned to change
SAOImage DS9 is an astronomical data visu-
the thresholds and contrast, activate different lu-
alisation software. It allows to work, perform,
minosity scales, measure sizes of elements on the
edit or make regions and colormaps manipula-
image, and produce surface brightness contours.
tion with FITS images and binary tables.
165 Results
Abstract
En esta sección se presentan los resultados obtenidos durante el tratamiento de datos que se
ha realizado. En primer lugar, se hace un estudio del mapa de velocidades obtenido a partir del
procesado de datos con GIST y la herramienta de visualización gráfica Mapviewer. Se exponen
tanto el mapa de velocidades como el de la dispersión de velocidades, ası́ como los mapas
asociados a los errores de ambos parámetros. Se hace una relación entre dichos resultados y
la morfologı́a de la galaxia NGC 4593. A continuación, se trata el mapa de luminosidad con
el software DS9, esbozando las isofotas y comentando las caracterı́sticas mas relevantes. Por
último, se ha hecho un tratamiento de datos a través del lenguaje de programación python para
obtener las dos curvas de rotación (aquella asociada a las velocidades positivas y otra para las
negativas) de la galaxia analizada.
5.1 NGC 4593 Morphology The Milky Way: a velocity dispersion of σ =
119 km s−1 , which is much larger than the typical
In this section, we try to find correlations be- σ for the disc [Lewis and Freeman, 1989]. Hence,
tween the behaviour of LOSVD maps, and the we conclude that we have a large σ? bulge in the
morphology of the host galaxy. innermost region of NGC 4593.
We present in Figure 8 the stellar kinematics
maps obtained during the GIST pipeline process-
5.1.2 Nuclear ring
ing of the NGC 4593 MUSE data cube.
We work with a radius of 4 arcsec in data, As we could read in Section 2.4, the nuclear
as we can observe in the axis of the maps. This ring presented in NGC 4593 has 880 pc in radius,
angular FOV allows us to see a small portion of which implies a 5.2 arcsec semimajor axis, and
the central region of NGC 4593, ∼ 700 pc in side. as we can observe, our data includes less than 4
arcsec. We are, then, inside of the nuclear ring,
5.1.1 Galactic Bulge making it impossible to see.
If NGC 4593 has a σ-drop related to the nu-
The most striking feature is the structure of V?
clear ring we could not see it in our data, because
map. We can detect a rapidly rotating disc. If
the drop in σ would fall outside of the FOV.
we observe the velocity dispersion behaviour, we
see a relatively high σ structure (∼ 100 km s−1 )
5.1.3 Strong Bar
enclosing the central region of the galaxy, that
supports the idea of a galactic bulge located in Apart from what we have seen in maps, it is
the innermost region of the galaxy. important to take into account the presence of a
The galactic bulge is understood as a small bar in NGC 4593.
stellar spheroid formation inside a galactic disc. The galaxy presents a prominent bar (Sec-
We found a σ? ∼ 100 km s−1 , that is compa- tion 2.4), that drives matter to the central re-
rable with what Valenti et al. [2018] found for gion. That can make us think about the possi-
17ble role that the bar could have in the velocity 5.1.5 pPXF fits
dispersion map. However, in the study of 20 dif-
The big uncertainty found at the centre is due
ferent galaxies made by Comerón et al. [2008], it
to the broad emission lines of the AGN that
has been established that the presence of a bar
make it hard to study the underlying stellar con-
does not affect directly behaviour of the σ at the
tinuum. In fact, we can see this in Figure 10.
centre of galaxies.
We show the pPXF fit in two different bins of
We could not study the properties of the bar
the data: one is from a central bin, as we have
of NGC 4593 because it has a 10.3 kpc in length
already said, the fit is bad and we cannot ob-
and we work with a FOV of barely 700 pc in side.
tain a good LOSVD fit; the second one is a bin
further away from the centre, presenting a good
fit.
In Figure 11 we show the fit for the complete
wavelength range studied. There we can see the
5.1.4 Treatment of errors difference in fits and how it changes between a
central bin and an external one.
The errors in the LOSVD maps during the Therefore, we can observe two notable emis-
pPXF routine process are illustrated in Figure 9. sion lines in the Hβ and Hα lines as we expect
The typical error for the velocity is about from a Seyfert 1 galaxy, and also it presents a
12 km s−1 , except at the centre, where the error strong emission in [N ii] line at 6547.96Å.
increase being lager than 30 km s−1 . The veloc- The velocity maps were made with the fit of
ity dispersion error is slightly higher, in general, Figure 10 and not with Figure 11, because the
at around 20 km s−1 , and in the central region it spectral range between 4800Å − 6690Å presents
exceeds 40 km s−1 . broad emission lines (such as Hβ and Hα) and
This is important to analyse the data obten- the mask could not cover all the impact that they
tion. We can disregard the central information made, affecting the fits. That is why we use the
due to the big error presented. 5050Å−5700Å range for our final map. Unfortu-
Also, on the right-down side of the σ? map, nately, these fits are still bad at the very centre of
we observe a weak increase on the dispersion the galaxy. An examination of Figure 10 shows
level, we relate this with a bad fit due to some that this might be due to a line at 5303Å that
noise in the signal. we identify as [Fe xiv].
18Figure 8: Kinematic momentum maps of NGC 4593. The colour scale is given at the right side of each
graphic in units of km s−1 . Left panel: Velocity distribution, V? . Right panel: Velocity dispersion,
σ? .
Figure 9: Kinematic momentum error maps of NGC 4593. The colour scale is given at the right
side of each graphic in units of km s−1 . Left panel: Velocity distribution error, ∆V? . Right panel:
Velocity dispersion error, ∆σ? .
19Figure 10: MUSE spectra of two different bins in the central region of NGC 4593. Here we show the
pPXF fits made in the wavelength range of 5050Å − 5700Å, the range without prominent emission
lines. The flux for each bin has units of 10−20 erg cm−2 Å−1 s−1 . Top panel: Fit of a galaxy’s region
strongly affected by the AGN emission. Bottom panel: Fit of a galaxy’s region less affected by the
AGN emission.
Figure 11: MUSE spectra of two different bins in the central region of NGC 4593. Here we show
the pPXF fits made in the wavelength range of 4800Å − 6690Å, the whole range with prominent
emission lines masked. The flux for each bin has units of 10−20 erg cm−2 Å−1 s−1 . Notice that the
line emission Hβ (at 4861.32Å) seems to not to be masked but that is due to a visualisation problem
of the Mapviewer software and actually this line is masked for the fit. Top panel: Fit of a galaxy’s
region strongly affected by the AGN emission. Bottom panel: Fit of a galaxy’s region less affected
by the AGN emission.
20Figure 12: Left panel: Surface brightness map as seen with DS9 obtained by collapsing the MUSE
data along the spectral axis (IMAGE FOV), with a black and white color scale (at the bottom) in
units of 10−20 erg cm−2 Å−1 s−1 Right panel: Same as the left map, but including the isophotes in
green lines.
5.2 NGC 4593 surface brightness sent those regions dominated by star, whereas,
the internal ones are associated with the bright
We have studied the luminosity map obtained
nuclear region dominated by the AGN emission.
by the MUSE pipeline by collapsing the data
cube along its spectral axis (IMAGE FOV data
5.3 Rotation curves of NGC 4593
produced) with the DS9 tool. In Figure 12 we
can clearly see the surface brightness map. In the data analysis of NGC 4593, we have
In the left map, we can observe a low surface made a velocity curve of the central region.
brightness spiral region probably due to a speck First, we have to find the major axis to make
of dust and gas converging on the nucleus. Prob- the velocity profile. Going to the HYPERLEDA
ably, at a small scale, this might contribute at database, we have found that the position an-
feeding the AGN. gle of the major axis is PA = 46.6◦ . However,
In the right map, we have obtained the looking at the rotational velocity map obtained
isophotes curves logarithmically spaced in in- in our analysis, we can determine that the kine-
tensity (at 500, 250, 125, 62.5 and 31.25 matic major axis has to be associated to y ∼ 0
10−20 erg cm−2 Å−1 s−1 ). They are characterised arcsec, with a PA = 90◦ . We know it because we
by a rather smooth and elliptical morphology, can see that the innermost region has the line of
indicating the lack of strong star formation zero velocity at x ∼ 0.
clumps. Hence, we conclude that the major axis of
The isophotes are situated in the innermost NGC 4593 changes with radius. This coincides
region of the galaxy within the nuclear ring. In with the orientation of the isophotes seen in Fig-
the outer part of the map, the isophotes repre- ure 12.
21Figure 13: Rotation curves of NGC 4593 without the correction in the inclination angle. We represent
the x-axis versus the velocity V? . In soft blue the positive rotation, in hard blue the negative rotation.
To plot the rotational curve, we take Moreover, it can be possible that the velocity
y = ±0.0125 arcsec, and all the values for x still increase with radius outside the FOV before
and V? associated with these y. Now, we make becoming constant.
a plot of the approaching rotation curve (with
positive values of x-axis) and the receding rota-
tion curve (with negative values of x-axis). We
can see in Figure 13 both curves.
Comparing with the Figure 5 of the galaxy
5.3.1 NGC 4593 central region mass
NGC 6503 seen in Section 2.5, we can observe
that the tendency is the same. However, in the
Our study allows us to know how much mass
central region of NGC 4593, inside the radius
there is inside 4 arcsec in NGC 4593. Using the
where the rotation has been measured, the ve-
equation 1 we can obtain this value.
locity does not became exactly constant, likely
We have to take into account that the real cir-
that is because we work with a maximum radius
cular velocity of the galaxy is V (sin i)−1 , where i
of 700 pc. Probably this innermost region has
is the inclination angle between the line of sight
more errors because we are near to the central
and the polar axis of NGC 4593, listed in HY-
BH, where we have more non-circular and ran-
PERLEDA as i = 34◦ .
dom motion than in the outer regions.
Hence, the mass is given by:
222
G = 6.674 · 10−11 N m2 kg−2 . Finally, we obtain
V
R
sin i that within 4 arcsec we have a total mass of:
M (R) = (7)
G
We use R = 700 pc, V = 120 km s−1 and M (R ∼ 4 arcsec) ∼ 7 × 10⁹ M (8)
236 Conclusions
Abstract
En esta sección se exponen las conclusiones del trabajo, que cumplen con los objetivos citados
en la Sección 3.
Se concluye que el aprendizaje de las diferentes herramientas de análisis de datos astronómicos
se ha realizado satisfactoriamente. Se ha aprendido a trabajar con archivos FITS, con el software
GIST, con Mapviewer y con el software DS9.
Se enumeran las conclusiones del análisis espectroscópico de NGC 4593 hecho a través de
MUSE. Hemos observado las siguientes caracterı́sticas: Un bulbo galáctico en la región más
interna (con σ ∼ 100 km s−1 ), fuerte presencia de las lineas Hβ y Hα, una espiral de polvo y
gas convergiendo hacia el núcleo galáctico y un cambio en la posición del semi eje mayor de
la galaxia según estamos en las regiones más internas o en las externas. Además, la curva de
rotación de NGC 4593 muestra una tendencia tı́pica presente en las regiones centrales de las
galaxias espirales, pudiendose calcular la masa de galaxia contenida en los 4 arcsec internos,
obteniendo una masa de ∼ 7 × 10⁹ M .
6.1 Technical features conclusions or the graphics displayed by Mapviewer
(not only kinematics maps could be repre-
From a technical point of view, it is concluded
sented, but we can also access other graph-
that the learning of the different astronomical
ics that show different aspects, such as
data analysis tools has been successfully com-
the surface brightness, or the S/N in each
pleted.
Voronoi Bin).
i. I have learned how to work with FITS files iv. I have learned to use the astronomical visu-
with several programs. alisation software DS9. I have been able to
ii. I have acquired knowledge about how to analyse surface brightness maps. We have
use the GIST software for data processing worked concepts such as threshold change,
by modifying the study parameters (wave- luminosity scales (in our case we focused
length ranges, masking of emission lines, on logarithmic scales due to the large dy-
S/N ratio . . . ) from the MasterCongif and namical range in brightness), the measure-
SpecMask KIN files. These are the ones ment of lengths within the image, or the
that have allowed me to carry out many generation of surface brightness contours.
tests before getting the final kinematics
maps of NGC 4593. 6.2 NGC 4593 features conclu-
sions
iii. I have learned to work with the graphical
visualisation tool Mapviewer, being able to On the other hand, the spectroscopic analy-
extract maps and interpret them. We have sis of NGC 4593, done with MUSE, gave us the
also worked with fits and other parame- means to make the first approach to this galaxy’s
ters such as the modification of the scale characteristics. We have studied its stellar kine-
24matic properties, the surface brightness, and the vi. The rotational curve of the innermost re-
velocity curves. Thus, from the MUSE results gion of NGC 4593 presents a trend similar
we have been able to reach the following conclu- to that other spiral galaxies. However, due
sions: to the proximity to the nucleus, it is likely
that we are not observing the region of the
i. NGC 4593 presents a central region with a
galaxy where a constant rotational velocity
σ? ∼ 100 km s−1 , which most likely corre-
is achieved.
spond to a bulge.
vii. We have obtained the mass contained
ii. It has been previously studied that
within the central 4 arcsec of the galaxy.
NGC 4593 has a nuclear ring and a strong
We concluded that M (R ∼ 4 arcsec) ∼
barred structure. However, through our
7 × 10⁹ M
study these morphologies could not be ob-
served due to the small FOV of MUSE
(we talk about 700 pc versus 900 pc and
10.3 kpc), witch is smaller than these two
structures.
iii. It has also been found that the central
spectra show strong emission in the Hβ
and Hα emission lines, as expected for a
Seyfert 1 galaxy. These, as well as other
emission lines already mentioned in this
paper, have been masked to obtain a good
fit of the stellar kinematics.
iv. NGC 4593 has a spiral lane of dust and gas
converging towards the galactic nucleus.
This infalling material is characterised by
a lower surface brightness than the sur-
roundings. Other than that, the central
region of NGC 4593 has smooth and ellip-
tical isophotes.
v. If we observe the outskirts region of
NGC 4593, we can see that the semi-major
axis has an angular position of PA = 46.6◦
(according to HYPERLEDA), while if we
observe the innermost 700 pc in the cen-
tral region, we can conclude, derived from
the kinematic study, that the semi-major
is close to PA = 90◦ .
25ski, Chris Packham, R Scott Fisher, and
References
Charles M Telesco. The infrared nuclear
Israel Matute Troncoso. Evolución de Núcleos emission of seyfert galaxies on parsec scales:
Activos de Galaxias en el Infrarrojo. PhD the- Testing the clumpy torus models. The
sis, Universidad de La Laguna, 2009. Astrophysical Journal, 702(2):1127, 2009.
Laura Ferrarese and David Merritt. A funda- Robert Antonucci. Unified models for active
mental relation between supermassive black galactic nuclei and quasars. Annual review of
holes and their host galaxies. The Astrophys- astronomy and astrophysics, 31:473–521, 1993.
ical Journal Letters, 539(1):L9, 2000.
H Winkler. Variability studies of seyfert
Cristina Ramos Almeida. Actividad nuclear y galaxies–ii. spectroscopy. Monthly Notices of
formación estelar en galaxias. PhD thesis, the Royal Astronomical Society, 257(4):677–
Universidad de La Laguna, 2009. 688, 1992.
Maarten Schmidt, Donald P Schneider, and Claudio Ricci, Roland Walter, TJ-L Courvoisier,
James E Gunn. Spectrscopic ccd surveys for and Stephane Paltani. Reflection in seyfert
quasars at large redshift. iv. evolution of the galaxies and the unified model of agn. Astron-
luminosity function from quasars detected by omy & Astrophysics, 532:A102, 2011.
their lyman-alpha emission. The Astronomical
Jorge Dıaz Tello. INVESTIGANDO EL FIN
Journal, 110:68, 1995.
DE FORMACION ESTELAR EN GALAX-
Geoffrey R Burbidge. On synchrotron radiation IAS MASIVAS. PhD thesis, Universidad Na-
from messier 87. The Astrophysical Journal, cional de Córdoba, 2014.
124:416, 1956.
Marisa Girardi, A Biviano, G Giuricin, Fabio
TM Heckman. An optical and radio survey of Mardirossian, and Marino Mezzetti. Velocity
the nuclei of bright galaxies-activity in normal dispersions in galaxy clusters. The Astrophys-
galactic nuclei. Astronomy and Astrophysics, ical Journal, 404:38–50, 1993.
87:152–164, 1980.
S Comerón, JH Knapen, and JE Beckman.
C Megan Urry and Paolo Padovani. Unified On the morphology of sigma-drop galaxies.
schemes for radio-loud active galactic nuclei. Astronomy & Astrophysics, 485(3):695–705,
Publications of the Astronomical Society of the 2008.
Pacific, 107(715):803, 1995.
H Wozniak, F Combes, E Emsellem, and
DE Osterbrock. Spectrophotometry of seyfert 1 D Friedli. Numerical simulations of central
galaxies. The Astrophysical Journal, 215:733– stellar velocity dispersion drops in disc galax-
745, 1977. ies. Astronomy & Astrophysics, 409(2):469–
477, 2003.
C Almeida Ramos, Nancy A Levenson,
JM Rodrı́guez Espinosa, Almudena Alonso- R Bacon, M Accardo, L Adjali, H Anwand,
Herrero, A Asensio Ramos, James T Radom- S Bauer, I Biswas, J Blaizot, D Boudon,
26S Brau-Nogue, J Brinchmann, et al. The muse neutral torus from optical and x-ray obscura-
second-generation vlt instrument. In Ground- tion in a complete volume limited hard x-ray
based and Airborne Instrumentation for As- agn sample. The Astrophysical Journal, 806
tronomy III, volume 7735, page 773508. In- (1):127, 2015.
ternational Society for Optics and Photonics,
2010. S Comerón et al., H Salo, E Laurikainen,
JH Knapen, RJ Buta, M Herrera-Endoqui,
Remko Stuik, Roland Bacon, Ralf Conzelmann, J Laine, Benne W Holwerda, K Sheth,
Bernard Delabre, Enrico Fedrigo, Norbert Hu- MW Regan, et al. Arrakis: atlas of resonance
bin, Miska Le Louarn, and Stefan Ströbele. rings as known in the s4g. Astronomy & As-
Galacsi–the ground layer adaptive optics sys- trophysics, 562:A121, 2014.
tem for muse. New Astronomy Reviews, 49
(10-12):618–624, 2006. Minbae Kim, Yun-Young Choi, and Sungsoo S
Kim. Effect of bars on evolution of sdss spiral
Gérard De Vaucouleurs, Antoinette de Vau-
galaxies. Monthly Notices of the Royal Astro-
couleurs, G Harold Jr, Ronald J Buta, Georges
nomical Society, 494(4):5839–5850, 2020.
Paturel, Pascal Fouqué, et al. Third Reference
Catalogue of Bright Galaxies: Volume III, vol- L Bottinelli, L Gouguenheim, G Paturel, and
ume 3. Springer Science & Business Media, P Teerikorpi. Extragalactic database. vi. incli-
2013. nation corrections for spiral galaxies and disk
opaqueness in the b-band. Astronomy and As-
Ronald J Buta, Kartik Sheth, E Athanas-
trophysics, 296:64, 1995.
soula, Albert Bosma, Johan H Knapen, Eija
Laurikainen, Heikki Salo, Debra Elmegreen,
VÍctor M Muñoz Marı́n, Rosa M González
Luis C Ho, Dennis Zaritsky, et al. A classi-
Delgado, Henrique R Schmitt, Roberto Cid
cal morphological analysis of galaxies in the
Fernandes, Enrique Pérez, Thaisa Storchi-
spitzer survey of stellar structure in galaxies
Bergmann, Tim Heckman, and Claus Lei-
(s4g). The Astrophysical Journal Supplement
therer. An atlas of the circumnuclear regions
Series, 217(2):32, 2015.
of 75 seyfert galaxies in the near-ultraviolet
Sébastien Comerón, JH Knapen, JE Beckman, with the hubble space telescope advanced
E Laurikainen, H Salo, I Martı́nez-Valpuesta, camera for surveys. The Astronomical Jour-
and RJ Buta. Ainur: Atlas of images of nu- nal, 134(2):648, 2007.
clear rings. Monthly Notices of the Royal As-
tronomical Society, 402(4):2462–2490, 2010. Edward M Cackett, Chia-Ying Chiang, Ian
McHardy, Rick Edelson, Michael R Goad,
Richard I Davies, Leonard Burtscher, David Keith Horne, and Kirk T Korista. Accretion
Rosario, Thaisa Storchi-Bergmann, Alessan- disk reverberation with hubble space telescope
dra Contursi, Reinhard Genzel, Javier Gracia- observations of ngc 4593: evidence for diffuse
Carpio, E Hicks, Annemieke Janssen, Michael continuum lags. The Astrophysical Journal,
Koss, et al. Insights on the dusty torus and 857(1):53, 2018.
27También puede leer