Geriatric Medicine The Journal of Latin American - Volume 4 - Number 2 - 2018 Published Quarterly - ISSN: 2462-2958 - www.conameger.org
←
→
Transcripción del contenido de la página
Si su navegador no muestra la página correctamente, lea el contenido de la página a continuación
The Journal of Latin American

                                          Geriatric
                                          Medicine
                                          Volume 4 – Number 2 – 2018
                                          Published Quarterly – ISSN: 2462-2958 – www.conameger.org

                                 ORIGINAL ARTICLES
                                 Risk factors for frailty syndrome in the Costa Rican population                   33
                                 José E. Picado-Ovares, Isabel Cristina Barrientos-Calvo,
                                 Fernando Morales-Martínez and Alejandro Sandí-Jirón
                                 Prevalence of diabetes mellitus by self‑report and hyperglycemia
                                 (subanalysis of the SABE survey)                                 39
                                 Gerardo Cerda‐Rosas, Francisco Javier López‐Esqueda,
                                 Gonzalo Ramón González‐González, Mercedes Yanes‐Lane,
                                 Miguel Ángel Mendoza‐Romo and Héctor Gerardo Hernández‐Rodríguez
                                 Systematic review and meta-analysis of frailty prevalence
                                 in Mexican older adults                                                           44
                                 Lorena Jocabed Rocha-Balcázar, Daniel Santiago Cortes-Sarmiento,
                                 Nicolas Castellanos-Perilla, Sagrario Núñez-Aguirre, Ricardo Salinas-Martínez
                                 and Mario Ulises Pérez-Zepeda
                                 Influenza and pneumococcal vaccination and physical
                                 disability in elderly ambulatory patients from a first level
                                 health-care center                                                                50
                                 Martha Ivón Mondragón-Cervantes, Yenesis del Carmen Jiménez-Acosta,
                                 Cristy Noemí De la Cruz-Pérez, Gabriela Vazquez-Armenta,
                                 Alfonso Franco-Navarro, David Leal-Mora and Julio Alberto Díaz-Ramos

                          COLEGIO NACIONAL
Official Journal of the   DE MEDICINA
                                                                                                 PERMANYER MÉXICO
                          G E R I ÁT R I C A                                                         www.permanyer.com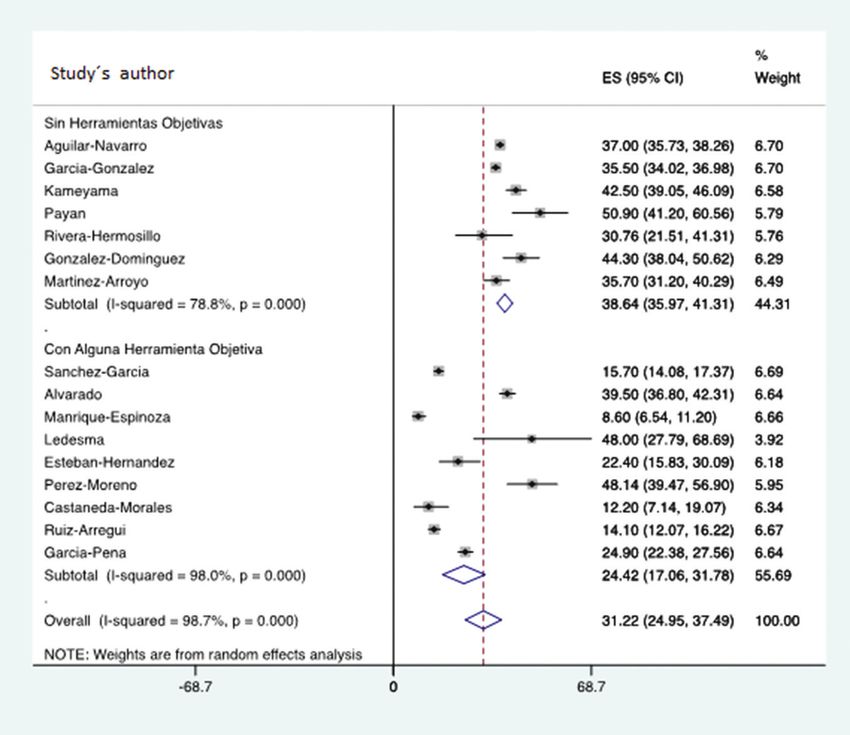
The Journal of Latin American

                                                       Geriatric
                                                       Medicine
                                                       Volume 4 – Number 2 – 2018
                                                       Published Quarterly – ISSN: 2462-2958 – www.conameger.org

Revista disponible íntegramente en versión electrónica en www.conameger.org

Editor en Jefe                                                         Comité Editorial
      Sara Gloria Aguilar Navarro                                            Ulises Pérez Zepeda
        Instituto Nacional de Ciencias Médicas y Nutrición                     Instituto Nacional de Geriatría. Ciudad de México
             Salvador Zubirán (INCMNSZ). Ciudad de México                    Juan Cuadros Moreno
                                                                               Instituto Mexicano del Seguro Social. Ciudad de México
       Coeditores                                                            Clemente Zúñiga Gil
                                                                               Hospital Ángeles Tijuana, B.C.
      J. Alberto Ávila Funes
        Instituto Nacional de Ciencias Médicas y Nutrición                   Ma. del Consuelo Velázquez Alva
             Salvador Zubirán (INCMNSZ). Ciudad de México                      UAM Xochimilco. Ciudad de México
      Jorgue Luis Torres Gutiérrez                                           Julio Díaz Ramos
                                                                               Antiguo Hospital Civil Fray Antonio Alcalde. Guadalajara, Jal.
        Hospital Regional ISSSTE. León, Gto.
                                                                             Alejandro Acuña Arellano
      Ivonne Becerra Laparra                                                   Hospital General Regional No. 251 IMSS. Metepec, Méx
        Fundación Medica Sur. Ciudad de México
      Miguel Flores Castro                                             Comité Editorial Internacional
        Antiguo Hospital Civil Fray Antonio Alcalde.
            Guadalajara ,Jal.                                                Mikel Izquierdo Redín (España)
                                                                             José Ricardo Jáuregui (Argentina)
Consejo Editorial
                                                                             Shapira Moises (Argentina)
      Luis Miguel Gutiérrez Robledo                                          Carlos Alberto Cano Gutiérrez (Colombia)
        Instituto Nacional de Geriatría.
             Ciudad de México                                                José Fernando Gómez (Colombia)
      Carmen García Peña                                                     Gabriela Villalobos Rojas (Costa Rica)
        Instituto Nacional de Geriatría.                                     Óscar Monge Navarro (Costa Rica)
             Ciudad de México
                                                                             José Francisco Parodi García (Perú)
      Carlos D´hyver de las Deses                                            Carlos Sandoval Cáceres (Perú)
        Universidad Nacional Autónoma de México.
            Ciudad de México                                                 Aldo Sgaravatti (Uruguay)
      David Leal Mora
        Antiguo Hospital Civil Fray Antonio Alcalde.
            Guadalajara, Jal.
      Jorge Reyes Guerrero
        Instituto Nacional de Ciencias Médicas y Nutrición
             Salvador Zubirán (INCMNSZ). Ciudad de México

                                           COLEGIO NACIONAL
Official Journal of the                    DE MEDICINA
                                                                                                                PERMANYER MÉXICO
                                           G E R I ÁT R I C A                                                       www.permanyer.com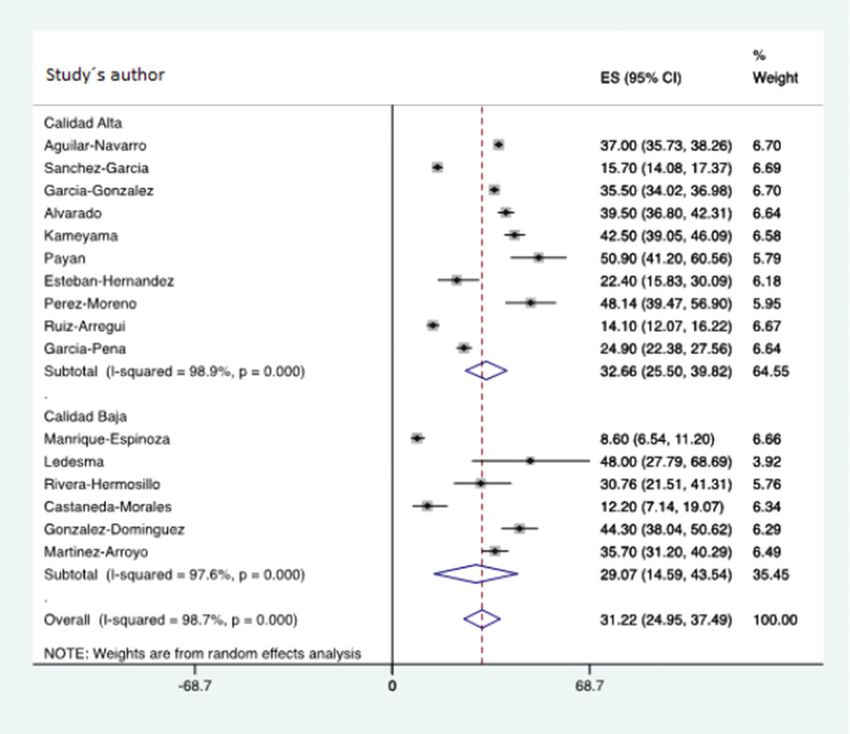
La revista The Journal of Latin American Geriatric Medicine es el órgano de difusión del Colegio Nacional Mexicano de Medicina Geriátrica.
Todo material publicado en la revista queda protegido por derechos de autor. La revista The Journal of Latin American Geriatric Medicine
no es responsable de la información y opiniones de los autores. Los manuscritos para ser publicados deberán ser enviados, en versión
electrónica, a la dirección electrónica: permanyer@permanyer.com.

© 2018 The Journal of Latin American Geriatric Medicine.

© 2018 de la presente edición: Permanyer México.

The magazine The Journal of Latin American Geriatric Medicine is the house organ of the Colegio Nacional Mexicano de Medicina
Geriátrica. All material published in the journal is protected by copyright. The magazine The Journal of Latin American Geriatric
Medicine is not responsible and shall not be held liable for the information and opinions of the authors. Manuscripts for publication
should be submitted electronically by mail: permanyer@permanyer.com.

© 2018 The Journal of Latin American Geriatric Medicine.

© 2018 of this edition: Permanyer México.

                                                              © 2018 Permanyer
                                               Mallorca, 310 – Barcelona (Cataluña), España
                                                       permanyer@permanyer.com

                                                           © 2018 Permanyer México
                                                                Temístocles, 315
          PERMANYER                                   Col. Polanco, Del. Miguel Hidalgo
         www.permanyer.com                                 11560 Ciudad de México                                  www.permanyer.com
                                                           Tel.: (044) 55 2728 5183
                                                           mexico@permanyer.com

                                                                                                       Edición impresa en México
                Impreso en papel totalmente libre de cloro
                                                                                                                 ISSN: 2462-2958
                Este papel cumple los requisitos de ANSI/NISO                                            Dep. Legal: B-21.964-2015
                Z39.48-1992 (R 1997) (Papel Permanente)                                                          Ref.: 4355AX172

                                                         Reservados todos los derechos
         Sin contar con el consentimiento previo por escrito del editor, no podrá reproducirse ninguna parte de esta publicación, ni
         almacenarse en un soporte recuperable ni transmitirse, de ninguna manera o procedimiento, sea de forma electrónica, mecánica,
                                                  fotocopiando, grabando o cualquier otro modo.
         La información que se facilita y las opiniones manifestadas no han implicado que los editores llevasen a cabo ningún tipo de
                                             verificación de los resultados, conclusiones y opiniones.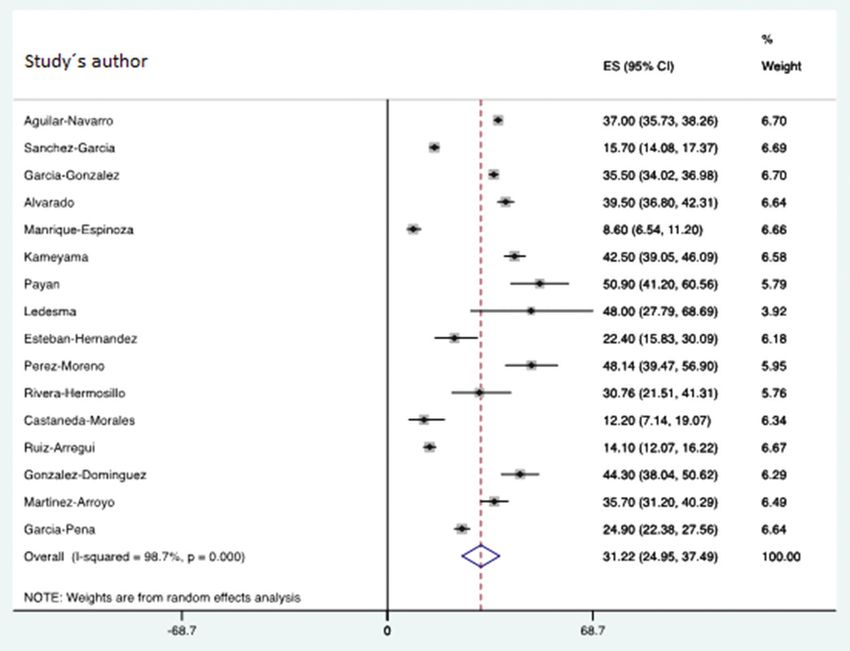
www.conameger.org J Lat Am Geriat Med. 2018;4:33-38
THE JOURNAL OF LATIN AMERICAN GERIATRIC MEDICINE ORIGINAL ARTICLE
Risk factors for frailty syndrome in the Costa Rican
population
José E. Picado Ovares1,2*, Isabel C. Barrientos Calvo1,2, Fernando Morales Martínez1,2 and
Alejandro Sandí Jirón
1
Hospital Nacional de Geriatría y Gerontología; 2Universidad de Costa Rica, San Pedro. San José, Costa Rica.
Abstract
Objective: The objective of this study was to identify the health risk factors related with the onset of frailty in the Costa Rican
population. Methods: A subgroup of 3000 people from the CRELES study was analyzed. A frailty phenotype was constructed
based on the variables of the phenotypic model: weight loss, exhaustion, weakness, slowness, and low level of physical activity.
Patients were classified into frail, pre-frail, and robust. A multinomial logistic model was used, which included data from the 3 years
of study (2205, 2007, and 2009). An exploratory analysis was made, using sociodemographic and health variables. Taking as ref-
erence the robust category, the odds ratio was obtained for the frail and pre-frail categories, with 95% confidence. Results: Of the
analyzed variables, age, osteoarthritis, and living alone proved to be risk factors with statistical significance. Conclusions: In the
Costa Rican population, age, osteoarthritis, and living alone represent risk factors for suffering frailty in the future.
Key words: Frailty. Risk factors. Elderly. Incidence.
Corresponding author: José Ernesto Picado-Ovares, jepicado@ccss.sa.cr
INTRODUCTION diminished gait speed, and poor physical activity that
reflects an underlying physiologic state of multisys-
Between 2000 and 2050, the number of inhabitants tem dysregulation2,4.
on earth aged 60 years or older will double. A consid- Multiple population studies have shown the rela-
erable number of them will have an elevated risk of tionship between frailty and diverse conditions5-7, and
becoming frail1. Frailty is considered a clinical state a few trials have been performed with Latin American
in which there is an increase in an individual’s vulner- populations and Central American populations5.
ability for developing increased dependency and/or The main goal of this study is to analyze the corre-
mortality when exposed to a stressor2,3. lation of multiple health and sociodemographic vari-
Although the operational definition of frailty is ables and the risk of suffering from frailty in the future
controversial, two approaches to defining frailty are within the Costa Rican population.
widely accepted3. The deficit model, which consists
of adding an individual’s number of impairments and MATERIALS AND METHODS
conditions to create a frailty index, and the second
model, the phenotype model, which describes frailty CRELES study
as a clinical syndrome resulting from a combination A longitudinal study design was established using
of variables, such as weight loss, fatigue, weakness, The Costa Rican Longevity and Healthy Aging Study
Correspondence to:
*José Ernesto Picado-Ovares
Department of Geriatric Medicine
Hospital Nacional de Geriatría y Gerontología
San José, Costa Rica
E-mail: jepicado@ccss.sa.cr
33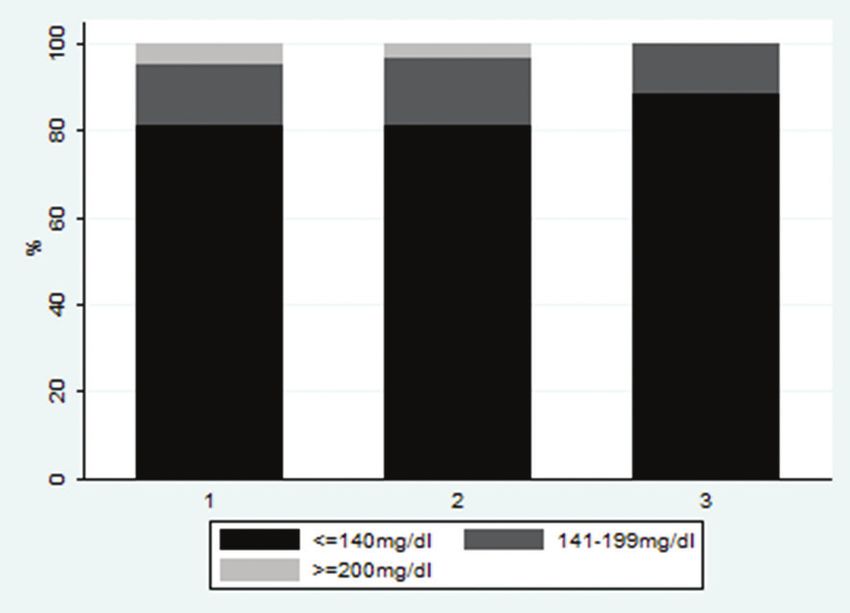
THE JOURNAL OF LATIN AMERICAN GERIATRIC MEDICINE. 2018;4

     (CRELES), which is a dataset of Costa Rican older                  adjusted, where the dependent variable was the
     adults born in or before 1946; it included a represen-             calculated speed and the independent variables
     tative sample of ≥ 60-year-old adults from Costa Rica.             were height and sex, obtained from the CRELES
     A full description of sampling methods may be found                database. The predicted values were calculated,
     elsewhere8. This study has three waves in which face-              and an average value was obtained. The residual
     to-face interviews were conducted by trained and                   values were added to this average value, which
     standardized staff at the homes of older adults includ-            results in a new speed variable from which the
     ing in-depth data collection on demographics, cur-                 20th percentile was calculated.
     rent activities, health-related issues, social support,         A decreased gait speed was considered if one of
     health-care use, financial status, functionality, cogni-     the following conditions was present: the patient had
     tive status, anthropometry, and blood sampling. The          a gait speed lower than the 20th percentile value, or
     analysis of the present study was performed using            the person could not do the test at all, or if the person
     a cohort of 2827 elderly people, 60 years and older,         answered affirmatively to the question: “Do you have
     beginning in 2005, with follow-ups in 2007 and 2009.         a problem that prevents you from doing any mobility
                                                                  or flexibility test?”
     Construction of the frailty variable                            – Low level of physical activity: For this variable, the
                                                                        answer for the question “In the past 12 months,
       A frailty indicator was constructed based on the five            have you had regular exercise or rigorous physi-
     variables from Fried’s phenotype model4, with certain              cal activity such as sports, trotting, dancing, or
     modifications. The variables were built as follows:                heavy workloads 3 times a week?” Was used. The
       – Weakness: To measure this variable, a grip                     variable was taken as is from the CRELES study,
          strength test performed with a dynamometer in                 and it was considered altered if there was no
          the CRELES study was used. The elderly individual             physical activity.
          was asked to extend his or her dominant arm to             – Exhaustion or poor endurance: The answer to
          full length alongside his or her body, and when               the question “Were you full of energy?” From
          instructed by the interviewer, the person was to              the CRELES study was used for this variable. The
          grip the handle with all their strength and imme-             variable was considered altered if the elderly
          diately loosen the grip. Then, he or she would                responded that they felt they had no energy
          rest for 3 min, repeating the test for the second             whatsoever.
          time. The result of the second grip strength test          – Weight loss: For this variable, the answer to the
          was used for this study. This variable was regis-             question, “In the past 6 months, have you lost >
          tered in the anthropometric questionnaire.                    5 kg of weight without planning it?” Was used. If
       A regression model was calculated in which hand                  the patient answered affirmatively, the variable
     strength was the dependent variable and the inde-                  was considered altered and was incorporated
     pendent variables were sex and body mass index.                    the frailty syndrome.
     Then, the residual values were added to the adjusted            Once the five variables were defined, they were cod-
     average value to create a standardized grip strength         ified as 1 if they met the frailty criteria on a particular
     variable. The 20th percentile was calculated, resulting in   variable, and 0 if the criteria were not met. A classifica-
     a cutoff value. The patient was considered to have an        tion of robust was given to those who did not present
     altered grip strength test if his or her result was below    altered variables on any of the five variables analyzed
     the 20th percentile or could not perform the test at all.    (which translates to a total sum of 0 for all variables), a
       – Slowness: To determine this variable, information        classification of pre-frail for those who presented one
          obtained from questions in the CRELES anthro-           or two altered variables, and a classification of frail to
          pometric chapter was considered. Gait speed             those who presented three to five altered variables. It
          measured the capacity and time necessary to             is worth mentioning that if any values were missing,
          perform the stand-up and walk test. This test           the individual was not included, as there was a strict
          consisted of asking the person to stand-up from         method to prevent biases for this categorization. This
          a chair and walk at his or her usual rhythm for a       methodology was also used for the cohort follow-up
          distance of 3 m. This distance is divided by the        years of 2005, 2007, and 2009.
          elapsed time, resulting in the speed of the elderly        With the goal of investigating possible risk factors
          individual. Afterward, the regression model was         for the frailty condition, an incidence analysis was
34
J.E. Picado-Olivares, et al.: Risk factors for frailty syndrome in the Costa Rican population

  Table 1. Costa Rica: Results of the prevalence and incidence model for frailty according to sociodemographic
  indicators

  Health and                                   Prevalence‡                                      Incidence§
  sociodemographic
  characteristics                 Pre‑frail                  Frail                  Pre‑frail                Frail
                             OR           CI           OR            CI       OR           CI        OR              CI
  Age
   80+                      4.86     2.07; 9.06*      20.77 10.23; 42.15*    4.12     1.07;15.86* 18.69      1.89; 184.72*
   70‑79                    1.69     1.31; 2.18*       2.25  1.51; 3.35*     1.46      0.89; 2.39 2.33         0.59; 9.22
  Education level
   ≤ 6th grade              2.09     1.53; 2.84*      1.77     1.00; 3.16      ‑            ‑         ‑              ‑
    7‑9th grade             1.83     1.19; 2.80*      1.64     0.74; 3.62      ‑            ‑         ‑              ‑
    ≥ 10th grade†             ‑           ‑             ‑           ‑          ‑            ‑         ‑              ‑
  Sex
    Woman                    1.15     0.88; 1.51      0.70     0.46; 1.08    1.34      0.78; 2.31   4.06      0.78; 21.17
  Live alone
   Yes                       1.17     0.78; 1.75      1.59     0.90; 2.79    1.43      0.55; 3.75   6.91     1.36; 35.20*
  Health
  self‑perception           2.34     1.82; 3.01*      5.60    3.78; 8.30*    2.00      1.11; 3.60   0.21      0.03; 1.37
   No healthy
  Income
    ≤ 100 US dollars        0.98      0.71; 1.34      1.23     0.75; 2.03    0.59      0.31; 1.12   1.62     0.31; 8.40
    100‑250 US dollars      1.01      0.75; 1.37      0.78     0.47; 1.28    1.01      0.55; 1.87   3.72     0.73; 18.87
    ≥ 250 US dollars†         ‑           ‑             ‑          ‑           ‑           ‑          ‑           ‑
  *p < 0.05.
  †
   category of reference.
  ‡
   model taking into account data of the year 2005.
  §
   data of 2005, 2007, and 2009 are included.
  CI: confidence interval at 95%; OR: odds ratio.

performed. For that analysis, data from the three fol-           taken as reference, as it was considered the healthi-
low-up years of the elderly cohort (2005, 2007, and              est among the three categories. To compare relevance
2009) were used. For this analysis, a multinomial logis-         and possible error in the OR estimation with 95% con-
tic model was used, including data for those 3 years,            fidence, intervals were created for each variable of
as well as the elderly identifier. The frailty indicator for     interest.
the study years was used as the dependent variable,
divided into frail, pre-frail, and robust. As inclusion cri-     RESULTS
teria for independent variables, the study focused on
an exploratory analysis in which a widespread quan-                For the year 2005 (base year for the study), after
tity of variables in the health and sociodemographic             application of the inclusion criteria mentioned above,
fields was considered based on expert judgment.                  an initial base sample consisting of 2827 patients
Specifically, the included variables were obtained               was used. Afterward, this sample was reduced for the
from the elderly questionnaire, Section C (health sta-           years 2007 (n = 2364) and 2009 (n = 1863). During this
tus) from CRELES, related to detected health condi-              period, a total of 964 cases were lost; a total of 525 due
tions by the physician. Other socioeconomic factors              to death and 439 because it was impossible to contact
were obtained from the same questionnaire from the               the individual for follow-ups.
section regarding personal identification data, as well            For the base year 2005, the final analysis shows a
as the employment and income sections. Variables                 prevalence of frailty in the elderly population of 11%.
that presented difficulties for model convergence                The general characteristics of the frail patient in Costa
were not included, nor were variables with missing               Rica were analyzed in a previous publication7.
information within their categories.                               Of the variables analyzed, only three proved to
   As a result, odds ratio for the frail and pre-frail cat-      be statistically significant risk factors. These vari-
egories was obtained, and the robust category was                ables were age (OR 18.6, CI 1.89; 184.73), presence
                                                                                                                                  35
THE JOURNAL OF LATIN AMERICAN GERIATRIC MEDICINE. 2018;4
Table 2. Costa Rica: Results of the prevalence and incidence model for frailty according to health and
comorbidities indicators
Variable Prevalence† Incidence‡
Pre‑frail Frail Pre‑frail Frail
OR CI OR CI OR CI OR CI
Hypertension
Yes 1.01 0.80; 1.27 1.52 1.04; 2.20* 1.31 0.85; 2.12 1.09 0.30 3.98
Cholesterol
Yes 0.94 0.75; 1.20 0.64 0.44; 0.93* 0.78 0.48; 1.27 1.38 0.38; 5.06
Diabetes
Yes 1.50 1.10; 2.03* 2.47 1.61; 3.79* 1.04 0.56; 1.94 3.74 0.63; 22.1
Cancer
Yes 1.99 1.06; 3.76* 2.12 0.92; 4.88 ‑ ‑ ‑ ‑
Pulmonary disease
Yes 1.62 1.16; 2.26* 1.82 1.14; 2.92* 0.49 0.21; 1.80 2.46 0.34; 17.9
Heart attack
Yes 0.78 0.45; 1.37 0.55 0.24; 1.28 ‑ ‑ ‑ ‑
Cerebrovascular event ‑
Yes 2.87 0.77; 10.71 20.90 5.31; 82.33* ‑ ‑ ‑
Arthritis
Yes 1.48 1.01; 2.17* 3.19 1.95; 5.22* 0.77 0.29; 2.04 5.46 1.08; 27.7*
Osteoporosis
Yes 1.43 0.91 ; 2.25 1.88 1.02; 3.46* ‑ ‑ ‑ ‑
Smoking
Yes 0.90 0.70; 1.16 0.83 0.55; 1.24 0.91 0.54; 1.53 1.88 0.39; 9.09
Falls
Yes 0.86 0.69; 1.08 1.03 0.72; 1.47 0.87 0.511; 1.48 0.73 0.18; 3.03
*p < 0.05.
†
model taking into account data of the year 2005.
‡
data of 2005, 2007, and 2009 are included.
CI: confidence interval at 95%; OR: odds ratio
of osteoarthritis (OR 5.46 CI 1.076; 27.65), and living associated with aging and secondary cellular damage
alone (OR 6.9 CI 1.36; 35.2). that triggers multiorgan and system failure, possibly
Other variables, such as hypertension, diabetes mel- resulting in vulnerability and decreased physiological
litus, dyslipidemia, cancer, lung disease, osteoporosis, reserves12,13.
heart failure, strokes, smoking, falls, educational level, Although age as a risk factor for frailty is not a new
income, and health self-perception, did not show any concept in other parts of the world, this is the first
significant association in this model (Tables 1 and 2). study performed in a Central American location show-
ing this correlation and is one of the few longitudinal
DISCUSSION
studies in Latin America5,14,15.
This study was also able to determine that osteo-
In this study, age was shown to be a risk factor for
arthritis is a risk factor for the presence of frailty in
the presence of frailty. Patients 80 years of age or
older presented an increased risk for becoming frail. the Costa Rican population. After adjusting for this
Furthermore, age 80 and above proved to be a risk variable, an increased risk for suffering frailty was
factor for presenting a pre-frail condition when com- documented. The risk was greater than what has been
pared to the robust patients (OR 4.12 CI 1.07; 15.9). presented in other similar studies14.
This result was similar to multiple publications that The association between frailty and arthritis has
have documented that age, per se, is a risk factor for been documented in other cohorts and longitudinal
the frail condition7,9-11. Various mechanisms can be studies previously performed7,16. Fried’s study has
mention as contributors, mainly the oxidative stress already documented a link between self-reported
36J.E. Picado-Olivares, et al.: Risk factors for frailty syndrome in the Costa Rican population
arthritis and frailty4. This finding has been reproduced Another limitation present in the study was the fact
in similar studies17, including in a Latin American pop- that many of the variables being analyzed were based
ulation cohort7,18, as well as in longitudinal studies9. on self-report of comorbidities. Many of the questions
The association between osteoarthritis and frailty were written in non-technical language, so interview-
is due to the limitation in physical activity second- ees could understand what they were asked.
ary to pain. There have been reports of an increase in Despite the study limitations, the results generated
the incidence of frailty syndrome and the presence of do represent the Costa Rican population. Furthermore,
secondary pain resulting from diseases such as osteo- the criteria used for this study were more similar to
arthritis19,20. Pain may lead to a decrease in physical Fried’s original criteria when compared to previous
activity, immobility, fatigue, and sarcopenia. studies at a national and international level, which
The “living alone” variable in this study was a risk fac- provided more robust results than in other similar
tor for the onset of frailty syndrome. Fried suggested a studies.
frailty model that includes a “vicious cycle” that com- The weight that certain comorbidities have in the
prises frailty, chronic malnutrition, sarcopenia, poor onset of the frailty syndrome in the Costa Rican elderly
chronic disease control, symptoms of depression, and population was demonstrated, being to the author’s
sedentarism4, all of which are more prevalent in the knowledge, one of the few Latin American studies and
elderly who live alone. the only one in Central America that truly analyses
To the author’s knowledge, this is the first longitu- these factors, allowing visualization of this important
dinal study that demonstrated this correlation. Other condition in this area of the American continent. This
cohort studies showed the relationship between allows us to assess the needs for future investigations
living alone and frailty4,17,21, including one trial that in this area and to take preventive actions involving
presented this condition as a protective factor10. This specific elderly groups to avoid frailty syndrome and
result warrants future investigations that include this its consequences.
variable as a risk factor for the presence of frailty syn-
drome and identifying mechanisms to protect the CONCLUSIONS
elderly from the consequences involved.
Given the longitudinal nature of the CRELES study, At present, there is little information regarding the
the analysis performed in the three study years risk factors that lead to the onset of the frailty syn-
involved many cases (n = 964) that were lost due to drome in the Latin American population and, specifi-
death and other unknown causes. This mainly affected cally, in the Central American population. In the Costa
the last year of the cohort. Loss of data significantly Rican population, age, the presence of osteoarthritis,
affected the construction of the frailty variable in the and living alone are risk factors for suffering this syn-
years under study, as five variables were used during drome in the future. Other variables did not show this
the time span, of which some presented problems association.
regarding missing information, therefore, affecting
the final elaboration of the frailty variable. REFERENCES
In addition, the variables of interest with regard to
1. World Health Organization.World Report on Ageing and Health. Available
the frailty syndrome present certain problems during from: http://www.apps.who.int/iris/bitstream/10665/186471/1/
the 3 years of the study, resulting in problems in the WHO_FWC_ALC_15.01_spa.pdf?ua=1. [Last accessed on 2017
Dec 10].
construction of the incidence model, as cases must be 2. Clegg A, Young J, Iliffe S, Rikkert MO, Rockwood K Frailty in elderly peo-
ple. Lancet. 2013;381:752-62.
matched across all years to allow its estimation. 3. Morley JE, Vellas B, van Kan GA, et al. Frailty consensus: a call to action.
The main consequence in this study can be J Am Med Dir Assoc. 2013;14:392-7.
4. Fried LP, Tangen CM, Walston J, et al. Frailty in older adults: evidence for
observed in the uncertainty reflected in the wide con- a phenotype. J Gerontol A Biol Sci Med Sci. 2001;56:M146-56.
fidence intervals for the variables analyzed. This was 5. Pérez-Zepeda MU Cesari M García-Peña C. Predictive value of frailty
indices for adverse outcomes in older adults. Rev Invest Clin. 2016;
caused by some large odds ratio and errors in estima- 68:92-8.
6. Romero RL, Abizanda SP. Frailty as a predictor of adverse episodes in
tion, which were also wide, resulting from a significant epidemiologic studies: a systematic review. Span J Geriatr Gerontol Rev
reduction of the sample size for some variables, along Esp Geriatr Gerontol. 2013;48:285.
7. Picado-Ovares J, Barrientos-Calvo I, Morales-Martinez F, et al. Frailty in
with their great variability. Therefore, when interpret- the elderly population of Costa Rica. Jpn J Med. 2018;1:5.
ing the final sample with less available cases, caution 8. Rosero-Bixby L, Xinia F, William HD. CRELES: costa Rican Longevity
and Healthy Aging Study. Costa Rica, Ann Arbor, MI: Inter-University
should be exercised regarding the results obtained. Consortium for Political and Social Research; 2005.
37THE JOURNAL OF LATIN AMERICAN GERIATRIC MEDICINE. 2018;4
9. Ottenbacher KJ, Graham JE, Al Snih S, et al. Mexican Americans and 16. León-Muñoz LM, Guallar-Castillón P, López-García E,
frailty: findings from the Hispanic established populations epidemio- Rodríguez-Artalejo F. Mediterranean diet and risk of frailty in commu-
logic studies of the elderly. Am J Public Health. 2009;99:673-9. nity-dwelling older adults. J Am Med Dir Assoc. 2014;15:899-903.
10. Woods NF, LaCroix AZ, Gray SL, et al. Frailty: emergence and conse- 17. Chang YW, Chen WL, Lin FG, et al. Frailty and its impact on health-
quences in women aged 65 and older in the women’s health initiative related quality of life: a cross-sectional study on elder community-
observational study. J Am Geriatr Soc. 2005;53:1321-30. dwelling preventive health service users. PLoS One. 2012;7:e38079.
11. Semba RD, Bartali B, Zhou J, et al. Low serum micronutrient concen- 18. Masel MC, Graham JE, Reistetter TA, Markides KS, Ottenbacher KJ.
trations predict frailty among older women living in the community. Frailty and health related quality of life in older Mexican Americans.
J Gerontol A Biol Sci Med Sci. 2006;61:594-9.
Health Qual Life Outcomes. 2009;7:70.
12. Mulero J, Zafrilla P, Martinez-Cacha A. Oxidative stress, frailty and cogni-
19. Danon-Hersch N, Rodondi N, Spagnoli J, Santos-Eggimann B. Prefrailty
tive decline. J Nutr Health Aging. 2011;15:756-60.
13. Cutler RG. Human longevity and aging: possible role of reactive oxygen and chronic morbidity in the youngest old: an insight from the
species. Ann N Y Acad Sci 1991;621:1-28. Lausanne cohort lc65+. J Am Geriatr Soc. 2012;60:1687-94.
14. Serra-Prat M, Papiol M, Vico J, et al. Incidence and risk factors for frailty 20. Serra-Prat M, Sist X, Saiz A, et al. Clinical and functional characterization
in the community-dwelling elderly population. A two-year follow-up of pre-frailty among elderly patients consulting in primary care centers.
cohort study. J Gerontol Geriatr Res 2017;6:452. J Nutr Health Age. 2016;20:653-8.
15. Da Mata FA, Pereira PP, Andrade KR, et al. Prevalence of frailty in Latin 21. Yamanashi H, Shimizu Y, Nelson M, et al. The association between living
America and the Caribbean: a systematic review and meta-analysis. alone and frailty in a rural Japanese population: the Nagasaki Islands
PLoS One. 2016;11:e0160019. study. J Prim Health Care. 2015;7:269-73.
38www.conameger.org J Lat Am Geriat Med. 2018;4:39‑43
THE JOURNAL OF LATIN AMERICAN GERIATRIC MEDICINE ORIGINAL ARTICLE
Prevalence of diabetes mellitus by self‑report and
hyperglycemia (subanalysis of the SABE survey)
Gerardo Cerda‐Rosas1, Francisco Javier López‐Esqueda1, Gonzalo Ramón González‐González1,
Mercedes Yanes‐Lane2*, Miguel Ángel Mendoza‐Romo3 and Héctor Gerardo Hernández‐Rodríguez4
1
Departamento de Geriatría, Hospital Central Dr. Ignacio Morones Prieto, San Luis, S.L.P., México; 2Departamento de Epidemiología y
Bioestadística, Universidad de McGill, Montreal, Canadá; 3Departamento de Investigación en Salud, Instituto Mexicano del Seguro Social, San
Luis, S.L.P., México; 4Departamento de Salud Pública, Facultad de Medicina, Universidad Autónoma de San Luis Potosí, San Luis, S.L.P., México
Abstract
Introduction and Objectives: Diabetes mellitus (DM) has become one of the most prevalent diseases of the XXIst century. The
objective of this study was to determine the prevalence of self‑reported DM and hyperglycemia in patients of 60 years and over
who participated in the Health, Well‑being, and Aging survey (SABE) in the city of San Luis Potosi. Materials and Methods: This
was a transverse study. A subanalysis of the data obtained in the SABE survey, as well as capillary blood glucose tests, was ana-
lyzed. Results: A total of 1854 patients were interviewed, with a mean age of 72 years. The prevalence found for self‑reported DM
was 22.44%, for undiagnosed diabetes 4.5%, and for hyperglycemia 14.3%. Conclusion: The prevalence of DM by self‑report, as
well as the hyperglycemia found in this study, suggests a higher prevalence of DM than in other places. Although the diagnosis of
DM is the same in older adults than in young adults, the pathophysiology is different, and this results in a hyperglycemia that is
not diagnosed. In low‑resource areas or in older patients in whom transportation is difficult, glucose tests can be used as a screen-
ing test for DM in this age range.
Key words: Elderly. Diabetes mellitus. Prevalence. Sabe.
Corresponding author: Mercedes Yanes Lane, mercedesyanes9@gmail.com
INTRODUCTION The WHO estimates that between 2015 and 2050
the population older than 60 years of age will tripli-
Aging is a dynamic process that has a common cate and go from 600 million to 2000 million, with the
denominator the loss of the body’s reserve mecha- highest increase in low‑ and middle‑income countries.
nisms. Because of this the body is less able to adapt to This represents a higher demand for health services
external changes. This is why older patients can develop by this sector of the population, due to non‑commu-
a state of frailty that increases the risk of developing a nicable diseases (NCDs) 4.
disability and dependence if exposed to disease1. In Mexico, in 2010, there were 10.1 million people
There is no definite consensus as to the age at older than 60 years of age which corresponds to 9%
which a patient becomes elderly. The American of the population. With an annual growth rate of 3.8%
Diabetes Association (ADA) includes patients older in the year 2013, there will be 20.4 million people in
than 65 years of age, whereas the World Health this age group. In the state of San Luis Potosi, there is
Organization (WHO) refers to elderly adults as any a growth rate of 3.2% which situates the state as the
adult older than 60 years of age2,3. 15th state with the most elders in the country5,6.
Correspondence to:
*Mercedes Yanes Lane
Avenida Venustiano Carranza, 2405
Col. Los Filtros
C.P. 78210, San Luis Potosí, S.L.P., Mexico
E‑mail: mercedesyanes9@gmail.com
39THE JOURNAL OF LATIN AMERICAN GERIATRIC MEDICINE. 2018;4
In Mexico, the aging process is not only reversible in the Health, Well‑being, and Aging survey (SABE) in
and as a result of the increase in this population there San Luis Potosi.
has also been an epidemiological transition charac-
terized by the presence of infectious diseases but also MATERIALS AND METHODS
by a rise in the prevalence of chronic NCDs7. Many of
these diseases are starting at earlier stages of life and This was a transversal study with a subanalysis
entering old age with a series of comorbidities, com- of the data obtained in the SABE survey in San Luis
plications, and disabilities8,9. Potosi. The methodology of the SABE survey was
Diabetes mellitus (DM) has become one of the used to calculate sample size per zone for inhabit-
most prevalent diseases of the XXIst century and is a ants of ≥ 60 years according to the II population and
global health concern. According to the International housing census of 2005 from the National Institute of
Diabetes Federation (IDF), one in every 11 adults in Geography and Statistics.
the world lives with DM as well as one‑third of elderly Confidence intervals at 95% were calculated and a
adults over 60 years of age. It is also important to high- standard error of ± 5% with a 50% success rate. The
light that one in every two adults is undiagnosed and sample size was calculated according to proportions
352 million people with hyperglycemia are at high risk considering a binomial distribution of the question-
of developing DM10. naire, where the probability of success is based on
The 10 countries with the highest prevalence’s of finding one or more adults ≥ 60 years in one house-
DM are China, India, the USA, Brazil, Mexico, Indonesia, hold. The total sample size was 2305 surveys, account-
Russia, Egypt, Germany, and Pakistan. At present, ing for loss a total of 2320 questionnaires were applied.
Mexico has 12 million people diagnosed with DM Of these, 1850 consented to capillary glucose test.
and the state of San Luis Potosi has one of the highest The survey consisted of 11 sections with 486 items
prevalences of the country11. in total and one section of identification data. The sur-
In the halfway health and nutrition survey vey was carried out in all of the state (58 municipali-
2016 (ENSANUT MC2016), the highest prevalence of ties), in urban and rural areas.
DM was among participants of 60‑70 years of age12. For this subanalysis, only the variables of interest
DM is a chronic metabolic disease that is due to a were selected. Capillary glucose measurement was
lack of secretion or action of insulin. The main risk fac- taken with a Accu‑Chek Performance meter. The cap-
tors are advanced age, obesity, malnutrition, seden- illary glucose tests were taken after the survey was
tary lifestyle, smoking, and genetic factors13,14. finished (approximately 2 h). All participants gave ver-
Insulin secretion and sensibility decrease with age. bal consent and personal data were kept by the main
Many factors contribute to insulin resistance in old researchers with confidentiality procedures.
age such as central obesity, secretion of vasopressin The data for the prevalence of DM were collected
or copeptin, Vitamin D deficiency, and hypomagnese- by self‑report. This implied that the person being
mia. A 15 mg/dl increase in postprandial glycemia has interviewed had a previous medical diagnosis of DM
been demonstrated after the third decade of life15. and was aware of having this disease. People that
Diagnostic criteria for DM is the same at any age: answered “I don’t know” were considered as not hav-
glycosylated hemoglobin (HbA1c) ≥ a 6.5%, fasting ing DM as well as people that answered no.
plasma glucose 126 mg/dl, plasma glucose 2 h after Age was categorized according to the WHO cri-
an oral dose of glucose ≥ 200 mg/dl, or a random mea- teria (60‑75 years, 76‑90 years, and 91‑100 years).
surement ≥ 200 mg/dl accompanied by symptoms16. The capillary glucose measurements were grouped
In elderly patients, it is important to take into into glycemia ≤ 140 mg/dl, 140 mg/dl‑199 mg/dl,
account that hyperglycemia symptoms are different and ≥ 200 mg/dl since the time since the last meal of
than in younger patients. These can be unspecific the patient was unknown but considered at least 2 h,
and of late‑onset such as fatigue, lethargy, cognitive considering that in Latin America you can only count
impairment, weight loss, urinary incontinence, falls, on the determination of capillary glucose and not with
and urinary symptoms17. plasma glucose for population screening, recogniz-
The objective of this study was to determine the ing that the definitive diagnosis must be made with
prevalence of self‑reported DM and hyperglycemia in the measurement of plasma glucose and that capil-
subjects older than 60 years of age that participated lary glycemia can have an average variability of 0.58
40G. Cerda-Rosas, et al.: Prevalence of diabetes mellitus by self-report and hyperglycemia (subanalysis of the SABE survey)
Table 1. Glycemic ranges by age group according to the WHO
Glycemia ranges 60‑75 years (CI 95%) 76‑90 years (CI 95%) 91‑100 years (CI 95%)
≤ 140 mg/dl 69.7% (67.13‑72.23) 73.8% (70.19‑77.43) 88.57% (77.87‑99.27)
141‑199 mg/dl 16.48% (14.42‑18.54) 17.75% (14.60‑20.89) 11.43% (0.73‑22.21)
≥ 200 mg/dl 13.84% (11.92‑15.75) 8.44% (6.15‑10.72) 0%
Frequencies calculated over 1854 participants.
CI 95%: confidence interval 95%
Table 2. Population characteristics
Variables With self‑reported DM (CI 95%) Without self‑reported DM (CI 95%)
Male 33.2% (28.6‑37.7) 46.5% (43.9‑49)
Female 66.8% (62.3‑71.4) 53.5% (51‑56)
60‑75 years 77.2% (73.11‑81.21) 64.60% (62.13‑67.08)
76‑90 years 22.6% (18.56‑26.63) 33% (30.6‑35.46)
91‑100 years 0.2% (−0.2‑0.7) 2.4% (1.6‑3.2)
Total 100% 100%
Glycemia ≤ 140 mg/dl 37.5% (32.83‑42.17) 81.1% (79.06‑83.11)
Glycemia 141‑199 25% (20.82‑29.178) 14.4% (12.58‑16.21)
mg/dl
Glycemia ≥ 200 mg/dl 37.5% (32.83‑42.17) 4.5% (3.44‑5.60)
Total 100% 100%
Frequencies calculated over 1854 participants.
CI 95%: confidence interval 95%, DM: diabetes mellitus
mmol/l when it is compared with blood glucose mea- A total of 22.44% of the surveyed people said that
surements. However, studies have been published they had diagnosis of DM (33.2% of the men and
that have found a high correlation coefficient (0.97) 66.8% of women). Whereas of the people that said
between both methods18. not to have DM, 4.5% had glycemia ≥ 200 mg/dl and
For the statistical analysis, central tendency and 14.4% had glycemia between 141 and 199 mg/dl. The
dispersion measurements were calculated as well characteristics of the population by diagnosis of DM
as frequencies for the according to variables. To cal- are shown in table 2.
culate the association between age and glycemia in When analyzing the association between age and
patients without self‑reported DM, we calculated X2 capillary glucose levels in patients without DM diag-
with Fisher’s exact test, given that there are categories nosis, there was no statistically significant result.
with < 5 observations. All statistical analyses were car- Figure 1 shows how of the studied population with-
ried out using STATA 12®. out diagnosis of DM there are no people with glyce-
mia ≥ 200 mg/dl in the age group of ≥ 90 years, and
RESULTS the number of patients with glycemia ≤ 140 mg/dl
increases with age.
Of the 1854 surveyed participants, 806 were male
and 1048 female. The age distribution was as fol- DISCUSSION
lows: 67.4% 60‑75 year olds, 30.7% 76‑90 years, and
1.9% > 90. The mean age was 72 years (SD 8) with a Diabetes in elderly patients is a risk factor for develop-
maximum age of 100. The mean capillary glucose was ing geriatric syndromes. This has become a challenge
139 mg/dl (SD 69) with a range of 54‑572 mg/dl. for government and health institutions given the rise
Capillary glucose levels by age category are shown in both life expectancy and aging. The prevalence of
in table 1. self‑reported DM in elderly patients has been reported
41THE JOURNAL OF LATIN AMERICAN GERIATRIC MEDICINE. 2018;4
represent undiagnosed DM. If we compare our results
to those of undiagnosed DM in Mexico and world-
wide, there is a lower prevalence of undiagnosed DM
in our population. This can be due to the diagnostic
method, capillary glucose versus glycosylated hemo-
globin or to a smaller number of participants and the
time at which the capillary tests was taken19.
Hyperglycemia is one of the main risk factors for the
appearance and progression of complications due to
DM. A sustained elevation provokes changes in tissue
and plasma proteins. This generates an accumula-
tion of superoxide at mitochondrial level. This is a key
step in the activation of metabolic pathways that are
Figure 1. Glucose measurements in patients with‑ implicated in the pathogenesis of complications in
out self‑reported diabetes mellitus by age group. patients with DM24,25.
1 = 60‑75 years; 2 = 76‑90 years; 3 = 91 and older; per‑
centage of the population. Due to a loss in the secretory phase of insulin, there
is postprandial hyperglycemia in elderly patients. This
to be 20.8%, similar to what we have found in this study is associated to higher cardiovascular morbidity and
of 22.44%19. mortality as has been described by studies such as
In the SABE 2010 survey in the state of Mexico, there diabetes epidemiology: collaborative analysis of diag-
was a reported prevalence of DM of 26.1% in people nostic criteria in Europe. This study shows that fasting
older than 60 years of age, while in the ENSANUT MC glucose does not contribute to the prediction of mor-
2016, there was a prevalence of 30.3% in people from tality but postprandial glucose does26.
60 to 69 years of age. Our study coincides with other The study CARMELA in Mexico demonstrated that
SABE results but differs from ENSANUT MC probably the glucose concentration increases with age. In our
due to the larger number of surveyed population in study, we found the opposite, a decrease of glycemia
ENSANUT MC12,20. with age. This could be explained because in our pop-
A study of the disease in San Luis Potosi shows that ulation the people that reach very old ages are those
the prevalence of DM will continue to rise and as such without DM27.
so will the geriatric syndromes. This binomial repre- At present, the association between geriatric syn-
sents a heavy load to health systems due to the costs dromes and DM has not been taken in to account by
it generates. There is an estimated expenditure of 27 the health systems in Mexico even though this popu-
thousand million dollars due to the DM, 58 thousand lation has a higher risk of hospitalization. There are
million due to its complications, and 31 thousand mil- no institutions for specialized care of chronic diseases
lion due to general costs19. even though there is a high prevalence28,29.
DM is still subdiagnosed in elderly patients. The per- Mexico occupies the eight places worldwide for
centage of undiagnosed cases reaches 41.5% among expenditure due to DM with an approximate of 19
individuals from 60 to 74 years of age21. Data from the thousand million dollars. This is added to the cost of
ADA report a prevalence of 23.8% of undiagnosed frailty syndrome that on average costs 191,102 pesos
diabetes22. In Mexico in patients older than 50 years of annually. If we understand that DM participates in
age, there is a prevalence of 18% of undiagnosed DM, geriatric syndromes using an integrated geriatric
in the age group of 60‑69 years, there is a 33.5% prev- evaluation, there could be a decrease in the health
alence, and in the > 70 years’ group 23%. The factors expenditure generated in the country30.
that are most associated in Mexican population to
undiagnosed DM are overweight and obesity23. Other CONCLUSION
studies carried out in Mexico report a prevalence of
undiagnosed DM of 10.23% in people > 60 years19. The increase in life expectancy is a reflection of a
The prevalence of hyperglycemia in our study was countries economic development. This increase in
of 37.5% in patients with diagnosis of DM and 4.5% in longevity is accompanied by physiological changes
patients without diagnosis. Glucose levels higher than that predispose the individual to a higher burden
200 mg/dL in patients without a diagnosis of DM could of diseases with atypical presentations which make
42G. Cerda-Rosas, et al.: Prevalence of diabetes mellitus by self-report and hyperglycemia (subanalysis of the SABE survey)
them a diagnostic challenge and decrease a success- http://www.who.int/mediacentre/news/releases/2004/pr60/es. [Last
accessed on 2018 Mar 06].
ful aging process. 9. Encuesta de Salud Bienestar y Envejecimiento SABE. San Luis Potosí:
Centro Nacional de Programas Preventivos y Control de Enfermedades;
The prevalence of DM by self‑report in our study 2012.
was higher than the national prevalence for elderly 10. Karuranga S, Fernandes J, Huang Y, et al. IDF Diabetes Atlas‑Home.
Diabetesatlas.org. 2018. Available from: http://www.diabetesatlas.
people. Furthermore, the prevalence’s of hyperglyce- org. [Last accessed on 2018 Mar 06].
11. Rojas R, Jiménez A, Barquera S, et al. Encuesta Nacional de Salud y
mia found in this study suggests that the prevalence Nutrición 2012. Resultados Por Entidad Federativa. San Luis Potosí.
of DM in older patients is higher than what has been Ensanut.insp.mx: 2013. Available from: http://www.ensanut.insp.mx/
informes/SanLuisPotosi‑OCT.pdf. [Last accessed on 2018 Mar 06].
reported elsewhere. 12. Hernández MM, Rivera J, Shamah T, et al. Resultados de la ENSANUT
MC 2016. Insp.mx. 2016. Available from: https://www.insp.mx/
Even though the diagnosis of DM is the same in older avisos/4576‑resultados‑ensanut‑mc‑2016.html. [Last accessed on
adults than in younger people, the physiopathology is 2018 Mar 06].
13. Aschner P, Mendivil C, Pinzon J, et al. Guias ALAD 2013. ALAD. 2013.
different, commonly affecting insulin secretory phase. Available from: https://www.issuu.com/alad‑diabetes/docs/guias_
This translates as a postprandial hyperglycemia which alad_2013. [Last accessed on 2018 Mar 06].
14. Huerta A, Tusie M. El componente genético de la diabetes tio2.
is why fasting glucose levels subdiagnose this dis- Rev ALAD. 2016;6:181‑92.
15. Wannamethee SG, Welsh P, Papacosta O, et al. Copeptin, insulin resis-
ease. In low‑resource populations or in older patients tance, and risk of incident diabetes in older men. J Clin Endocrinol
in which transportation are difficult, capillary glucose Metab. 2015;100:3332‑9.
16. Handelsman Y, Bloomgarden ZT, Grunberger G, et al. American asso-
tests could be used as a screening test to detect more ciation of clinical endocrinologists and American college of endocri-
nology‑clinical practice guidelines for developing a diabetes mellitus
patients with DM in this age range. comprehensive care plan‑2015. Endocr Pract. 2015;21 Suppl 1:1‑87.
The strengths of this study lie in the large number 17. Navarrete A, Avila F. Diabetes mellitus y el síndrome de fragilidad en el
anciano. RIC. 2010;62:327‑32.
of participants from different populations, including 18. Rodríguez C, Navarro P, Rodríguez L, et al. Exactitud y precisión de
reflectómetros empleados para determinar la glucemia capilar.
indigenous, of San Luis Potosi. Endocrinología. 1993;40:12‑4.
19. Diabetes Statistic Report. Centers for Disease Control and Prevention.
2018. Available from: https://www.cdc.gov/features/diabetes‑statis-
AGRADECIMIENTOS tic‑report/index.html. [Last accessed on 2018 Mar 06].
20. Encuesta de Salud Bienestar y Envejecimiento SABE2000, México:
Centro Nacional de Programas Preventivos y Control de Enfermedades;
Marco Vinicio González‑Rubio, María Lourdes 2000.
21. Statistics about Diabetes. American Diabetes Association. 2018.:
Reyna‑Carrizales, Carlos González‑Camacho, María http://www.diabetes.org/diabetes‑basics/statistics. [Last accessed on
Cleofas Ramírez‑Arriola, Rafael Nieva Nieva de Jesús y 2018 May 05].
22. Yanase T, Yanagita I, Muta K, Nawata H. Frailty in elderly diabetes
Lourdes Marcos‑Ramírez. patients. Endocr J. 2018;65:1‑1.
23. Kumar A, Wong R, Ottenbacher KJ, Al Snih S. Prediabetes, undiag-
nosed diabetes, and diabetes among Mexican adults: findings from the
REFERENCES Mexican health and aging study. Ann Epidemiol. 2016;26:163‑70.
24. Ihnat MA, Thorpe JE, Ceriello A. Hypothesis: the ‘metabolic memory’,
the new challenge of diabetes. Diabet Med. 2007;24:582‑6.
1. Alvarado A, Salazar Á. Análisis del concepto de envejecimiento. 25. Testa R, Bonfigli AR, Prattichizzo F, et al. The “Metabolic memory” theory
Gerokomos. 2014;25:57‑62. and the early treatment of hyperglycemia in prevention of diabetic
2. American Diabetes Association 11. Older adults: standards of medical complications. Nutrients. 2017;9:E437.
care in diabetes‑2018. Diabetes Care. 2018;41:S119‑S125. 26. DECODE Study Group. Glucose tolerance and mortality: comparison of
3. La Salud Mental y Los Adultos Mayores. Organización Mundial de la WHO and American Diabetes Association diagnostic criteria. Diabetes
Salud. 2018. Available from: http://www.who.int/mediacentre/fact- epidemiology: collaborative analysis of diagnostic criteria in Europe.
sheets/fs381/es. [Last accessed on 2018 Mar 06]. Lancet. 1999; 354:617-21.
4. Datos Sobre el Envejecimiento y La Salud. Organización Mundial de La 27. Escobedo‑de la Peña J, Buitrón‑Granados LV, Ramírez‑Martínez JC, et al.
Salud. 2018. Available from: http://www.who.int/features/factfiles/age- Diabetes in Mexico. CARMELA study. Cir Cir. 2011;79:424‑31.
ing/es. [Last accessed on 2018 Mar 06]. 28. Carlos HD, Teresa L, Lorenza MP. Prevalencia de síndromes geriátricos
5. (INEGI) I. Censo de Población y Vivienda 2010. Beta.inegi.org.mx. en el 2010 en ancianos hospitalizados en el ABC medical center IAPEs.
2018. Available from: http://www.beta.inegi.org.mx/proyectos/ Rev Fac Med. 2011;54:4‑11. Available from: http://www.scielo.org.mx/
ccpv/2010. [Last accessed on 2018 Mar 06]. scielo.php?script=sci_arttext&pid=S0026‑17422011000500002&lng
6. Instituto Nacional de estadística y Geografía. Perfil sociodemográfico =es. [Last accessed on 2018 Mar 06].
de adultos mayores. 2010. Disponible en: http://internet.contenidos. 29. Bello‑Chavolla OY, Aguilar‑Salinas CA, Avila‑Funes JA. Geriatric syn-
inegi.org.mx/contenidos/productos/prod_serv/contenidos/espa- dromes and not cardiovascular risk factors are associated with cogni-
nol/bvinegi/productos/censos/poblacion/2010/perfil_socio/adul- tive impairment among Mexican community‑dwelling elderly with
tos/702825056643.pdf Type 2 diabetes. Rev Invest Clin. 2017;69:166‑72.
7. Cabrera RR, Gutiérrez L. Longevidad y Sus Implicaciones. 1st ed. México, 30. Villarreal E, Paredes G, Vargas R, et al. Costo de la atención médica de
DF: José Paiz Tejada; 2013. pacientes con síndrome de fragilidad vs. pacientes con pre‑fragilidad.
8. OMS. La Organización Mundial de La Salud Lanza Una Nueva Iniciativa Rev Cubana Med Gen Integr. 2015;31:61‑8. Available from: http://www.
Para Afrontar Las Necesidades Sanitarias Que Plantea El Rápido scielo.sld.cu/scielo.php?script=sci_arttext&pid=S0864‑212520150001
Envejecimiento de La Población. Who.int. 2018. Available from: 00009&lng=es. [Last accessed on 2018 Mar 05].
43www.conameger.org J Lat Am Geriat Med. 2018;4:44-49
THE JOURNAL OF LATIN AMERICAN GERIATRIC MEDICINE ORIGINAL ARTICLE
Systematic review and meta-analysis of frailty
prevalence in Mexican older adults
Lorena Jocabed Rocha-Balcázar1, Daniel Santiago Cortes-Sarmiento2,3, Nicolas Castellanos-Perilla1,2,
Sagrario Núñez-Aguirre4, Ricardo Salinas-Martínez4 and Mario Ulises Pérez-Zepeda1,2*
1
Department of Internal Medicine, Family Medicine Clinic “Villa Álvaro Obregón”, Instituto de Seguridad y Servicios Sociales para los
Trabajadores del Estado, Mexico City, Mexico; 2Department of Geriatric Research, Instituto Nacional de Geriatría, Mexico City, México;
3
Semillero de Neurociencias y Envejecimiento, Instituto de Envejecimiento, Facultad de Medicina, Pontificia Universidad Javeriana, Bogotá,
Colombia; 4Centro Regional para el Estudio del Adulto Mayor, Departamento de Medicina Interna, Hospital Universitario “Doctor José Eleuterio
González”, Facultad de Medicina, Universidad Autónoma de Nuevo León, Monterrey, N.L., México
Abstract
Introduction: Frailty is a common condition in older adults, which consists in an increased vulnerability to stressors and
a higher frequency of adverse outcomes, after this exposure. Objective: The objective of this study was to conduct a system-
atic review and meta-analysis on the prevalence of frailty in Mexican older adults and explain the causes of heterogeneity.
Methods: Systematic review of the literature on the prevalence of frailty in Mexican older adults including gray literature. Meta-
analysis with random effects was performed for all studies and subsequently stratified by potentially explanatory characteristics
(type of tool, sample, sex of the participants, type of publication, age of the participants, etc.). Period prevalence, confidence
intervals (CI), and heterogeneity are reported. Results: Of a total of 16 studies included with 18,965 older adults, the prevalence
of frailty was 31.2% (95% CI: 24.9-37.4%), with a heterogeneity of 98.7%. When classifying frailty with subjective tools, the lowest
heterogeneity was obtained (78.8%), with a prevalence of 38.6% (95% CI: 35.9-41.3). Conclusion: The significant variability of
the prevalence between the studies is increased by some individual characteristics included resulting in a variety of definitions,
diagnostic tools, and interpretations in relation to the frailty of research.
Key words: Older adults. Geriatrics. Frailty.
Corresponding author: Mario Ulises Pérez-Zepeda, mperez@inger.gob.mx
INTRODUCTION increasing number of manuscripts about frailty in the
web search engines (e.g., 79 manuscripts in 1990 for
Frailty is a common condition affecting older adults the term frail elderly in PubMed rising up to 1004 at
that consist in an increased vulnerability to stressors the end of 2017). Furthermore, Mexico is a peculiar
with consequently higher adverse outcomes when case, it is a middle-income country, and in compari-
exposed to those stressors1. Different reports have son, with similar countries in Latin America, it has out-
shown a great difference between the prevalence standing research on the matter4-6.
of frailty in the older adult population. Specifically, a Two main methods are the most widely used to
systematic review on this topic described prevalence classify frailty nowadays, Fried’s frailty phenotype
going from 3% to 40%2. Despite these heterogeneous and Rockwood’s frailty index7,8. However, some meth-
results, researchers and clinicians continue to push a odologic problems have arisen - particularly from the
“unified” concept of this topic1,3. This is depicted in the phenotype- and were accurately described in a recent
Correspondence to:
*Mario Ulises Pérez-Zepeda
Research Office of the Instituto Nacional de Geriatría
Anillo Periférico Sur, 2767
Col. San Jerónimo Lídice, Del. La Magdalena Contreras
C.P. 10200, Ciudad de México, México
E-mail: mperez@inger.gob.mx
44L.J. Rocha-Baltazar, et al.: Systematic review and meta-analysis of frailty prevalence in Mexican older adults
Potentially relevant studies initially Reason of exclusion:
Inicial search in: Pubmed, found in databases by title.
Google scholar, Tesiunam. (n=161) • Studies with duplicate
Keywords: population
1. Aged • Studies with European
2. Frailty population
a. Frail older adult • Studies in Mexican
b. Aged frail -American
3. Prevalence • Full text not
4. Mexico available
a. Mexican • No abstract
Relevant studies that met the (n=134)
inclusion keywords
(n=27)
Reviewed Abstracts
9 studies with duplicate
Complete review population
of the article 1 full text not available
and inclusion in the 1 does not have a
meta-analysis. prevalence of fragility
(n=16)
Figure 1. Flowchart of literature systematic review of frailty prevalence in Mexican older adults
report by Theou et al. showing that there are over studies regarding number of subjects, year of the data,
200 versions of the frailty phenotype reported in the and other additional information were considered.
geriatric literature9. This problem could be of a greater Afterward, once we had the selected studies, preva-
magnitude when it comes to different sociocultural lence and limits of the confidence intervals (CI) were
settings, or, in other words, there is an increased risk of abstracted from each text. However, if the information
getting “lost in translation”10. In this scenario, issues of was not available, it was estimated by the total num-
reproducibility, reliability, and basic understanding of a ber of subjects, and if this was not available the corre-
concept are endangered by an incorrect taxonomy. sponding author of the study was contacted to retrieve
Our hypothesis is that even though the analysis is this information. The meta-analysis was summarized in
circumscribed to a specific country, there still are many forest plots, giving both individual and group data in
differences that cannot be accounted to the sociocul- addition to the relevance of each study. Fixed effects
tural background of the older adults being studied, were first estimated, if the heterogeneity was >15%, a
but rather other various facts. Therefore, the aim of this random effect approach was used. To analyze hetero-
report is to review the literature that includes frailty’s geneity, a first step stratified analysis for characteris-
prevalence in Mexican older adults and to explain the tics of the studies was done that included the follow-
possible heterogeneity of the reported prevalence ing characteristics: quality of the text (see below for
perceived among this topic in a specific population. description), year of publication of the study, mean age
of the population, classifying tool used, use of objective
METHODS measurements, type of manuscript (thesis or published
article), and origin of the sample (national or local).
A systematic review of the literature was done
to extract those studies where frailty prevalence Literature search
was explicitly described in Mexican older adults.
We included those studies that accounted only for A systematic review of the literature was done to
those older adults living inside the Mexican Republic, extract those studies where the prevalence of frailty is
excluding reports of Mexican Americans or per- explicitly described in Mexican seniors.
formed by Mexican researchers but in other popula- The included studies were only of older adults living
tion. Selected studies and the flow to arrive to them in the Mexican Republic, who met the requirements
are depicted in figure 1. for this research and had informed consent; exclud-
In brief, general characteristics of the selected ing Mexican-American reports or reports of Mexican
45También puede leer


