Quantitative Risk Assessment of Environmental Hazards Generated by a Tailings Embankment: case study Cabeço do Pião, Portugal
←
→
Transcripción del contenido de la página
Si su navegador no muestra la página correctamente, lea el contenido de la página a continuación
Fiúza, A., et al, 2021. Quantitative Risk Assessment of Environmental Hazards Generated by a Tailing Embankment..., 132 (4): 465-486
ISSN: 0366-0176
DOI: 10.21701/bolgeomin.132.4.006

 Quantitative Risk Assessment of
 Environmental Hazards Generated by a
 Tailings Embankment: case study Cabeço do
 Pião, Portugal
 A. Fiúza, A. Leite, M. Vila, M.L. Dinis, A. Futuro, J. Gois y J. Figueiredo

 Centro de Recursos Naturais e Ambiente (CERENA), Faculty of Engineering, University of Porto, Rua Dr. Roberto Frias s/n,
 4200-465 Porto, Portugal

 ABSTRACT
 The Panasqueira mine is a world-class tungsten mine and probably one of the most important in Europe,
 having been continuously in operation since 1898. Between 1927 and 1996, the ore was fully or partially pro-
 cessed in a processing plant located on the left bank of the Zêzere River. The tailings were stored along the
 bank, in an extension of about 1.5 km. The fine particles, locally known as ‘sludge’, were stored in a self-cons-
 tructed embankment located on a steep hillside. The current average slope is about 36°. The sludge has high
 concentrations of some heavy metals (Cu, Zn, W and Cd) but has a particularly high concentration in arsenic
 (about 15%). This tailings storage was not included in the National Plan for Rehabilitation of Abandoned Mi-
 nes, despite presenting a high environmental risk.
 A quantitative environmental risk assessment characterises this situation, considering two possible alternati-
 ves: the current state with continuous release of contaminants or, alternatively, the situation that would arise
 from an eventual collapse of the storage embankment. In the first situation, we used a classical methodology
 of risk assessment to estimate the concentrations of arsenic in the affected compartments using a conser-
 vative exposure scenario and inferring the doses to which the local population is subjected. These doses are
 compared with reference acceptable values. In the second situation, the creation of a dispersed source of
 contamination encompasses a much higher dispersion area, a larger population and more expensive rehabi-
 litation costs.

 Keywords: environmental risk assessment; tailings embankment; arsenic; geochemistry.

 Evaluación Cuantitativa de Riesgos Ambientales Generados por Una Presa de
 Relaves: caso de estudio Cabeço do Pião, Portugal
 RESUMEN
 Desde 1898, Panasqueira es una de las principales minas de tungsteno del mundo, y probablemente la más
 importante de Europa, habiendo estado continuamente en exploración. Entre 1927 y 1996 los minerales fue-
 ron procesados en una planta metalúrgica en las orillas del río Zêzere. Los relaves de este tratamiento se
 almacenaban a lo largo de la margen izquierda del río, en una extensión de aproximadamente 1.5 km. Las
 partículas finas (‘lodos’), se almacenaron en una presa autoconstruida situado en una ladera que ya tenía
 originalmente una elevada pendiente. La pendiente media actual es de unos 36°. Los lodos tienen altas con-
 centraciones en algunos metales pesados, siendo muy alta en arsénico (alrededor del 15% en peso). Este
 depósito de relaves no fue incluido en el Plan Nacional de Rehabilitación de Minas Abandonadas, a pesar de
 presentar un alto riesgo ambiental.
 Para cuantificar esta circunstancia, se preparó una evaluación cuantitativa del riesgo ambiental, teniendo en
 cuenta dos posibles situaciones: la actual, con liberación continua de contaminantes y, alternativamente, la
 situación que se derivaría del colapso de la presa. En la primera situación, se utilizó una metodología clásica
 de análisis cuantitativo del riesgo ambiental, estimando las concentraciones de arsénico en los compartimen-
 tos afectados utilizando un escenario de exposición conservador para inferir las dosis a las que está sujeta la
 población local. En la segunda situación resultaría la creación de una fuente dispersa de contaminación abar-

 465
Fiúza, A., et al, 2021. Quantitative Risk Assessment of Environmental Hazards Generated by a Tailing Embankment..., 132 (4): 465-486

 cando un área de influencia mucho más alta, una población más grande y mayores costos de rehabilitación.

 Palabras clave: Evaluación de riesgos ambiental, presa de relaves, arsénico, geoquímica.

 VERSIÓN ABREVIADA EN CASTELLANO

Este artículo presenta un Análisis Cuantitativo de circulante del agua infiltrada a través de la presa.
Riesgo Ambiental y Toxicológico (ACRAT) sobre el Las muestras recogidas permitieron la caracteri-
almacenamiento de ‘lodos’ (relaves del proceso de zación física (densidades, porosidad, distribución
tratamiento de minerales con granulometría fina) granulométrica), química (composición química, mi-
existentes en el sitio llamado Cabeço do Pião y que neralógica y pH) y ambiental (lixiviación natural y
fueron producidos por una planta de tratamiento de producción de ácidos). La distribución espacial de las
minerales que allí operó entre 1927 y 1996 y que des- concentraciones de los principales elementos poten-
de entonces ha sido abandonada. cialmente contaminantes fue estudiada por métodos
 Los lodos almacenados (alrededor de 730000 m3) geo-estadísticos. También se determinaron otros pa-
son constituidos por varios minerales, muchos de los rámetros relevantes, como la composición y la con-
cuales existen en forma de sulfuros, especialmente centración de lixiviados y la concentración y distribu-
piritas y arsenopyrite. Por acción del oxígeno y del ción espacial del polvo.
agua, y en algunos casos por acción microbiana, los Al mismo tiempo, existían numerosos estudios
sulfuros se oxidan progresivamente a sulfatos, libe- publicados sobre el estado de contaminación de los
rando ácido que a su vez lixivia algunos de los meta- diversos compartimentos ambientales: aguas superfi-
les presentes. En el proceso de oxidación de sulfuros ciales y subterráneas, suelos, polvos, y flora. Sin em-
de hierro, los óxidos de hierro-hidróxidos se forman bargo, estos estudios nunca se habían combinado en
como un producto final. un enfoque integrado, que permitiese una visión ge-
 Los lixiviados se producen en el almacenamiento de neral sistémica destinada a evaluar cuantitativamente
relaves y se liberan en la pendiente, en una zona de el riesgo ambiental resultante de la existencia de este
resurgimiento, inmediatamente por debajo de la pre- almacenamiento de residuos.
sa de apoyo fluyendo a la base de la encosta, donde Además de estos riesgos, que actualmente se co-
una fracción de estos lixiviados se diluye por la mez- locan continuamente, motivados por la erosión física
cla en el río y otra parte es sorbida por los óxidos e y química de la presa, también existe la posibilidad
hidróxidos de hierro formados. de un escenario de catástrofe – la ruptura parcial del
 Los relaves almacenados tienen altas concentracio- almacenamiento los relaves por picos de lluvias in-
nes en algunos metales pesados, a saber, en arsénico, tensas y/o acción sísmica, aunque esta última con una
zinc, cobre y tungsteno. Por lo tanto, existe una libera- probabilidad muy baja de ocurrencia.
ción continua de contaminantes, y el arsénico es tan En la ejecución del análisis de riesgo, se utilizó una
dominante, debido al alto contenido de los relaves en metodología clásica, estudiando la fuente de conta-
arsenopirita, que los otros contam minación, los mecanismos de liberación, el transporte
 inantes pueden ser ignorados comparativamente. y destino de contaminantes, las características de los
Además de esta liberación, acrece la acción eólica medios de receptores, un escenario de exposición de
porque los residuos están directamente expuestos a la población a estos, la determinación de las dosis re-
la atmósfera, sin ninguna cubierta. Los dos vectores sultantes de dicha exposición y, por último, el cálculo
dispersivos, el agua y el aire, son responsables del de los parámetros toxicológicos que permiten evaluar
transporte y destino de contaminantes que se distri- cuantitativamente las consecuencias de la situación.
buyen por los distintos compartimentos ambientales. Se consideraron dos escenarios. En el primero, el
 Gran parte de la información producida en el marco riesgo ambiental y toxicológico resultante de la situa-
de un proyecto europeo Era-Min (Remine) se utilizó ción actual se evaluó cuantitativamente utilizando, en
en este estudio. El inventario de los relaves existentes la medida de lo posible, modelos matemáticos para
fue realizado por un dron y digitalizando la topografía estimar las concentraciones en los medios recepto-
original. La presa de deposición se muestreó mecá- res, comparándolas con los valores medidos. Adop-
nicamente y se obtuvieron 80 muestras a diferentes tando un escenario normalizado de exposición de la
profundidades. Esta información se complementó población a los medios receptores, se estimaron las
con seis perforaciones que ya se habían realizado an- dosis resultantes de esta exposición y, por último, se
teriormente, así como mediante un estudio geofísico evaluaron los riesgos toxicológicos y carcinógenos
utilizando un radar penetrante de los suelos. Por lo utilizando la información de la base de datos IRIS,
tanto, fue posible construir un modelo conceptual de recomendado por la EPA (Environmental Protection
la presa de almacenamiento y estimar los volúmenes Agency) para estudios ambientales de este tipo.
de los diferentes materiales almacenados. Este mo- El arsénico fui considerado el único contaminan-
delo asociado con los datos meteorológicos del sitio te importante. Se consideró que la exposición de la
permitió establecer un balance hídrico y el régimen población local se producía por ingestión (consumo

 466
Fiúza, A., et al, 2021. Quantitative Risk Assessment of Environmental Hazards Generated by a Tailing Embankment..., 132 (4): 465-486

de agua, ingestión de suelos, verduras y consumo mental exposure are developed through several steps
de pescado), inhalación de polvo y contacto dérmico (Trapp and Matthies, 1998): a) definition of purpose
con el polvo de la atmósfera. Los valores obtenidos and scope; b) identification of underlying physical,
nos permitieron inferir, que existen altos riesgos para chemical and biological processes; c) formulation of
la salud humana, en las perspectivas tóxicas y can- mathematical equations that will be used in the mo-
cerígenas, para las exposiciones por ingestión y por del; d) data acquisition; e) verification and calibration
contacto dérmico, siendo la exposición por inhalación of the model structure; f) sensitivity analysis.
aceptable. This paper presents a partial Quantitative Environ-
 En el segundo escenario, se consideró una situación mental Risk Analysis for Human Health resulting from
catastrófica con ruptura parcial de la presa de almace- the storage of fine mine tailings (‘sludge’) existing at
namiento, en que se añade a el escenario anterior la the site called Cabeço do Pião, near the active Panas-
liberación de un volumen considerable de fase líquida queira Mine, constituted by waste produced by a for-
(ácido lixiviado con alta concentración en arsénico) y mer ore processing facility, which ran in the site be-
fase sólida, el ‘lodo’ que sería dispersado por grandes tween 1927 and 1996, and which has been abandoned
áreas en la zona ribereña del río Zêzere. Se caracterizó ever since. Several minerals constitute the stored slu-
el tipo más probable de ruptura, se estimó los volú- dge (about 730, 000 m3), many of which occur in the
menes de residuos y lixiviados que se liberarían, así form of sulphides, especially pyrite and arsenopyrite.
como la zona que se vería afectada por el derrame. By the action of oxygen and water, and in some cases
 by microbial action, the sulphides have been progres-
Introduction sively oxidised into sulphates, releasing hydronium
 cation, which in turn has leached some of the metals
The fundamental concepts for Environmental Risk As- present. The tailings embankment affects the local en-
sessment were created by the U.S. National Academy vironment by aquatic transport and transformation of
of Sciences that suggested a four-stage process (La- the leachates, the spread of dust by the wind and by
Grega et al., 1994): a) Hazard identification; b) Expo- the risk of failure of the embankment.
sure assessment; c) Toxicity assessment; d) Risk cha- Numerous surveys exist which describe the state of
racterisation. contamination of the various environmental compart-
 The concept was first applied by the Environmental ments – surface and groundwater, soil, dust and flora
Protection Agency (EPA) in 1984 for carcinogens (La- (Candeias, 2015, Ferreira da Silva, 2013, Candeias C a,c,
Grega et al., 1994), issuing carcinogenic potency fac- 2014, Avila, 2016). However, these studies have never
tors (CPFs) that could be used in predictive models to been linked in an integrated approach, allowing for a
estimate the carcinogenic risk of potentially exposed global systemic view that aims to evaluate quantitati-
populations. A similar approach was later applied to vely the environmental and human health risks resul-
non-carcinogens by setting acceptable daily intake le- ting from the existence of this waste storage.
vels, later replaced by reference doses (RfDs). The conceptual foundation behind environmen-
 When contaminants are released into the environ- tal risk assessment has been subjected to many cri-
ment, they may reach damaging concentrations. The ticisms, the most important being the following: the
concentration at the target is called exposure. The results of quantitative risk assessment may not be
product of exposure with the specific conditions of ex- subject to validation by observation (Brown, 1985).
posure (rate of breathed air, daily intake of water,…) Assessment of the risk is difficult (a) because the ex-
is called the dose. The relationship between dose and posure is usually well below levels at which lethal to-
its damage, quantified by the RfDs or by the CPFs, is xic effects and even sub-lethal effects can be measu-
the risk. red with statistical significance against the “noise” of
 Risks for non-carcinogens are assessed by the ra- natural population variation, and (b) because of the
tio between the “predicted environmental concentra- simultaneous multiple toxic influences of other subs-
tion” and the “predicted no-effect concentration”, or tances, some taken voluntarily and others involuntari-
reference dose. This ratio is commonl known as the ly (MacKay, 2001).
toxicity index, and should be lower than one. For car- The risk assessment is not an end in itself, but a
cinogens, risk is the product of the predicted environ- process to develop policies that make the best use of
mental concentration by the CPF and represents the resources to protect the health of the public and of
incremental risk caused by that particular source that ecosystems (US EPA, 2014) and an important tool to
adds to the background one. support decision quantitatively.
 The estimation of environmental exposure has the Abandoned tailing embankments represent in
following purposes (Wagner and Matthies, 1996): a) many cases environmental risks of great environmen-
to determine concentrations in relevant environmen- tal concern, potentially affecting human health and
tal compartments; b) to understand the transport and ecosystems. Surprisingly, quantitative environmental
fate processes; and, c) to identify endangered popu- assessment has not yet been applied to these situa-
lations. tions, although this tool may represent an important
 The mathematical models used to assess environ- aid for the decision-maker who is helping to establish

 467
Fiúza, A., et al, 2021. Quantitative Risk Assessment of Environmental Hazards Generated by a Tailing Embankment..., 132 (4): 465-486

the priorities of remediation. winter. The climate is aggressive in the region, hot
 and dry during the summer and cold, rainy and windy
Objectives in the winter. The average annual rainfall is 1,600 mm.
 Snow frequently falls above the altitude of 700 m. The
The main objective of the research was to integrate average annual temperature is 12°C, with values rang-
all the information that was explicitly produced wi- ing from 0°C in the winter to about 30°C in summer
thin the European Era-Min Project (Remine, 2019), (Gonçalves, 2014).
with existing and published former studies, in order
to assess the environmental and human health risk The Panasqueira ore deposit
derived from the existence of this particular mine
tailings storage. A classical methodology was used The Panasqueira ore deposit is a typical example of
(Fjeld, 2007; Trapp 1997), considering the following a Sn-W hydrothermal mineralisation associated with
steps: assessment of the release of the contaminants, the Hercynian plutonism (Noronha, 1992). The mine-
the definition of the liberation mechanisms, transport ralised zone has an average length of 2,500 m, a width
and destination, characterisation of the intermediate ranging from 400 to 2,200 m and extends at least 500
receiving media, formulation of an exposure scena- m in depth. The Panasqueira Mine has been active for
rio and, finally, the assessment of the resulting doses over 100 years and is one of the largest economic wol-
and final quantification of the environmental toxicolo- fram vein deposits in the world (Franco, 2014). During
gical ratios, using the EPA database for environmental the period 1934-2016 it produced 128,110 t of tungs-
studies of this type (US EPA, 2013). ten concentrate, 6,576 t of tin concentrate and 32,410
 As stated, we considered two different risk alternati- t of copper concentrate (data supplied by LNEG). The
ves. For the first, we assessed the environmental risk Panasqueira deposit consists of a series of stacked,
that results from the present situation. For the second, sub-horizontal, hydrothermal quartz veins intruding
we considered a catastrophic situation with partial into the Beira schists and shales. The paragenesis is
failure of the tailings embankment. In this case, the complex and four stages of mineral formation are ge-
release of a considerable volume of pulp was con- nerally accepted (Noronha, 1992):
sidered, with high concentrations in arsenic in both - The oxide and silicate formation stage: the most
phases that would be dispersed through vast areas in important stage from an economic point of view
the riparian zone of the Zêzere River. because it is when the formation of wolframite
 Whenever possible, concentrations in the environ- and cassiterite occurs and also the formation of
mental compartments that were measured under the quartz, muscovite, tourmaline, topaz and a lar-
research developed within the REMINE Project (Remi- ge part of the arsenopyrite (in 2 phases);
ne, 2019) or published by other researchers who have - The sulphide formation stage: mainly the for-
devoted their attention to this relevant environmental mation of sulphides, namely pyrite, chalcopyri-
problem, were used. Sometimes there are gaps in in- te, sphalerite and pyrrhotite and the occurrence
formation that cannot be filled without making new of a new generation of quartz, muscovite and
studies which would forcibly be lengthy. Appropriate arsenopyrite.
mathematical models were used to estimate the spa- - The pyrrhotite alteration stage: a large amount
tial and temporal distribution of the concentrations, of siderite and marcasite were formed, due to
with very conservative values for the uncertain para- the iron released in the alteration process of the
meters. pyrrhotite and some pyrite. A new generation
 of pyrite occurred; some magnetite, hematite,
Area of study galena, stannite and chalcopyrite were formed;
 The commonest minerals found are quartz, wol-
The Panasqueira Mine, in Portugal, has ben exploited framite, pyrite, pyrrhotite, arsenopyrite, chalcopyrite,
for wolframite, cassiterite and, chalcopyrite (W, Sn, cassiterite, beryl, mica and fluorite.
Cu), the latter two as by-products (Reis C., 1972; Sá, During its lifetime, three processing plants were
1999) since 1898. Until 1912 the mining scale was very used: Panasqueira, Cabeço do Pião and Barroca
small, but it increased up to 1928 and finally became Grande. The construction of the Panasqueira Plant be-
a large exploitation (Sá, 1999). One of the seven areas gan in the 19th century and was progressively trans-
of exploitation was the Cabeço do Pião where the tail- ferred, from 1928 onwards, to the Barroca Grande
ings were deposited from 1927 to 1996 (Sá, 1999). The Plant which has a more central location, more avail-
waste was produced by one of the three processing able area, greater access to water and other advantag-
plants that existed at the mine, the Rio or Cabeço do es that led to its deactivation in the 1960s (Sá, 1999).
Pião Processing Plant (Sá, 1999). The location is the As already commented, the Rio processing plant was
following: Latitude: 40° 07’ 32.71’’N and longitude: 7° built in 1927. With the abandonment of the exploita-
42’ 51.18’’W. The local topography in the area ranges tion of the Panasqueira vein, and due to the greater
from 350 to 1,080 m, with deep valleys. The streams availability of water of the Zêzere River, this plant only
are generally dry in summer and flooded during the treated the pre-concentrates that came, first by aerial

 468
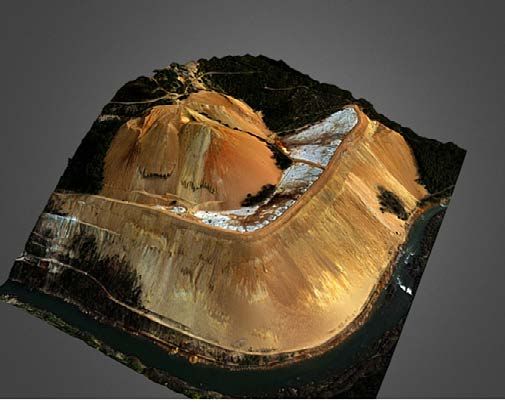
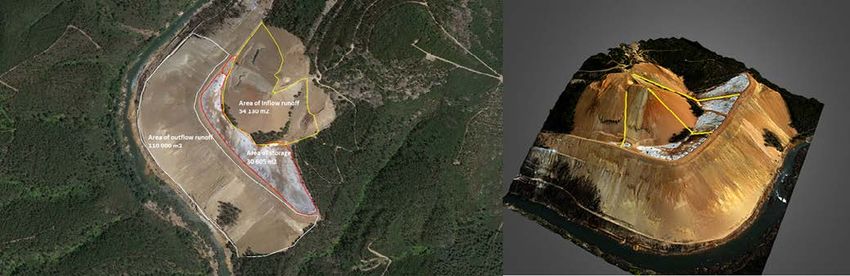
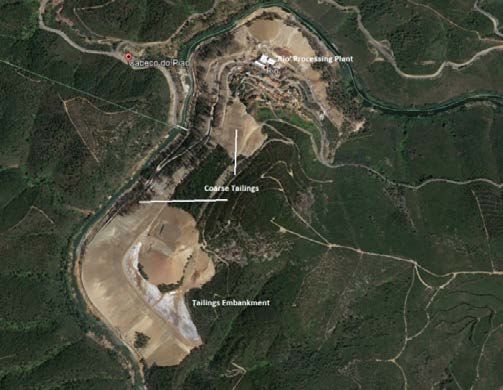
Fiúza, A., et al, 2021. Quantitative Risk Assessment of Environmental Hazards Generated by a Tailing Embankment..., 132 (4): 465-486

cable and later by truck from the Barroca Grande Plant 2017). Therefore, it includes not only the sludge, but
(Reis C., 1971). At the end of the 1980s, the Panasque- also the retaining walls of the dam and the material
ira mine had enough extension so that the drainage used for the smoothing of shapes, which is essentially
water was sufficient to supply the necessary flow to sandy material. It also took into consideration an an-
the entire industrial structure. For this reason, but cient drilling campaign (Gama, 2002) and a GPR sur-
also in order to rationalise costs and minimise the en- vey previously made at the site (Silva, 2010).
vironmental impact, the centralisation of all the ore The following methodology was used (Remine,
processing operations was carried out in the Barroca 2019):
Grande between 1992 and 1996 (Reis C., 1971). - Firstly the original topography of the site (befo-
 In the old industrial zone of Cabeço do Pião, on the re the construction of the dam) was digitalised
slope of the left bank of the River Zêzere, two types of from an old map of the mining company that
mining waste are stored (Fig. 1): operated at the site.
a. Coarse tailings originating from the former pro- - From this scan a three-dimensional model of
 cessing plant, either in a rake classifier or as tai- the original topography was built.
 lings from shaking tables. This waste occupies an - A drone was programmed for a flight path over
 extension of 1.5 km on the slope, extending into a the site, with photogrammetric data acquisition
 non-uniform distribution from the processing plant using a series of georeferenced points with high
 area to the sludge embankment. It contains low le- precision GPS.
 vels of heavy metals and sulphides with a reduced - From this data it was possible to produce a 3D
 potential environmental impact (Silva, 2010). numerical model of the current topography of
b. Fine tailings, commonly referred to as ‘sludge’, the tailings dam (Fig. 2);
 consisting of depressed material from flotation - Combining the two above-mentioned models
 cells, or overflow of cyclones, with high levels of it became possible to build a 3D model of the
 heavy metals and sulphides, with a very high po- rejected storage and from these calculate the
 tential for a negative environmental impact. Its volume of material existing on the site.
 storage area, locally called “Sludge Embankment”,
 was auto-constructed, taking advantage of the to-
 pography of the site, and using the coarse waste
 to create the supporting wall of the embankment
 (Reis C., 1971).

 Figure 2.Tri-dimensional model of the sludge storage in the tailings dams.
 Figura 2. Modelo tridimensional del almacenamiento de lodos en
 la presa de relaves.

Figure 1. The tailings embankment area (Google view). Sampling of the tailings
Figura 1. Vista da área de la presa de relaves.
 A sampling plan was carried out considering a sam-
Methodology pling grid with dimensions of 40 x 20 m (Salom, 2017,
 Gois, 2018). A total of eighty samples were collected,
Estimated volume of the deposit with 40 ‘superficial’ (20 to 30 cm deep) and the remai-
 ning 40 with an average depth slightly greater than
The volume of the deposit was estimated by the di- 1.5 m. The samples were collected by digging using a
fference between the current topography and the one mechanical excavator with an articulated arm. Coordi-
existing before the deposition of the tailings (Salom, nates of each sample were measured.

 469
Fiúza, A., et al, 2021. Quantitative Risk Assessment of Environmental Hazards Generated by a Tailing Embankment..., 132 (4): 465-486

Methods for the physical, chemical and environmen- made of stainless steel, with an area of 50 cm2. They
tal characterisation of the tailings are fixed to masts in places where the coordinates are
 measured. A layer of silicone (polydimethylsiloxane),
The following parameters physically characterised that captures the settled dust, covers their surface.
the samples: volumetric mass density and porosity, The plates remain at the chosen location for a long
both according to standard EN 1097-4:2008 ( Comité time, usually one or more months, after which they
Européen de Normalisation, 2008) and the grain size are collected.
distribution measured by a Malvern Mastersizer 2000 In the laboratory the silicone layer is dissolved and
particle size analyser using laser diffraction. The sett- the mass of dust collected is weighted, allowing for
ling velocity of the particles was estimated from the assessing the depositional flux (µg m-2 h-1), represen-
former data using Stoke’s law with correction for hin- ted by the letter J. From the flux and knowing the se-
dered settling (Major, 1998). ttling velocity of particle deposition u (m/h) it is possi-
 The following parameters were used for the chemi- ble to estimate the average concentration of dust in
cal characterisation of the samples: chemical compo- the atmosphere (µg m-3) (equation 1).
sition of tailings and ‘sand’, mineral composition by
X-ray diffraction (Granjeia et al., 2011) and pH. The ( −2 ℎ−1 )
 ( −3 ) =
chemical composition was assessed by analysing ( ℎ−1 )
all the 80 samples by energy dispersive X-ray fluo-
rescence (Oxford Instruments X-MET 7500, mining Two campaigns of dust collection were executed:
mode). The mineral composition was not specifica- one in February and March and another in June-July
lly determined in the Remine project as it did exist in 2018. As expected, the deposition flux in the winter
former studies published by Granjeia (2011). The pH season was lower than the flow observed during the
of the tailings was measured in water and with CaCl2 summer period.
(Minasny, 2011).
 For the environmental characterisation of the samples Quantitative risk assessment of environmental ha-
the following two tests were carried out: natural leaching zards generated by a tailings embankment
with water and tests of acid generation.The first tests fo-
llowed the standard DIN38414-S4 and the second ones The quantitative risk assessment of environmental
followed procedures defined by Coastech, 1999. hazards generated by the tailings embankment was
 elaborated according to the following methodology
Atmospheric dispersion – assessment method (representative scheme shown in Fig. 3): a) characteri-
 sation of the source, including a survey of the initial (or
The particle deposition flux was assessed in the su- reference) state; this includes the selection of the ha-
rrounding area of Cabeço do Pião using sedimenta- zardous elements based on toxicology and legislation;
tion plates for dust collection, according to the French b) mechanisms of liberation (leaching, wind and dust);
standard NF X43-007 (1973). Sedimentation plates are c) mechanisms of transport or dispersive vectors (air,

Figure 3. General scheme of a Quantitative Environmental Risk Assessment.
Figura 3. Esquema general de una evaluación cuantitativa del riesgo ambiental.

 470
Fiúza, A., et al, 2021. Quantitative Risk Assessment of Environmental Hazards Generated by a Tailing Embankment..., 132 (4): 465-486

surface water, groundwater); d) mechanisms of trans-
fer to environmental compartments (sorption, deposi-
tion, degradation,…); e) assessment of concentrations
within each environmental compartment using models
of environmental dispersion; f) inventory of the expo-
sed sites (wells, inhabited areas); g) identification of
receiving agents (local water consumers, population,
special groups, …); h) selection of standardised expo-
sure scenarios of the population to contaminated sites;
i) determination of doses for each exposure pathway
(ingestion, inhalation and dermal contact).

Characterisation of the contamination source

The characterisation of the source included the fo-
llowing aspects:
a) a survey of the former mining area based on an
environmental perspective; Figure 4. Particle size distribution of different superficial and deep
b) an estimation of the tailings volume; samples.
c) sampling of the tailings; Figura 4. Distribución del tamaño de partícula de diferentes
 muestras superficiales y profundas.
d) physical, chemical and environmental characterisa-
tion of the tailings;
e) climate, hydrological cycle and model of water cir-
culation;
f) quantification of hazardous elements existing in the
embankment;
g) oxidation of sulphides and formation of acid mi-
ning drainage;
h) considerations regarding structural stability and
risk of rupture.

Quantification of stored material

The following quantification of the deposit was obtai-
ned: stored volume of ‘ sludge’, 730,000 m3; total vo- Table 1. Typical grain sizes and coefficients for an average superficial
lume of the storage area, including supporting walls, sample and a deep sample.
 Tabla 1. Tamaños y coeficientes de granos típicos para una muestra
1200,000 m3; total volume of material deposed com- superficial y profunda promedio.
pared to the original topography, 2630,000 m3. We can
conclude that about 61% of the material existing in Chemical characterisation of the tailings
the storage area is made up of fine tailings, whilst the
remaining 39% was used to build the support wall and Chemical composition
for smoothing the topography.
 All the samples showed an acidic pH varying from
Physical characterisation of the tailings 1.4 to 3.6. However, the ‘superficial’ samples have a
 lower pH than the ‘deeper’ ones. The most intense
The total average wet density was 2.23 whilst the bulk acidity of the superficial samples is attributed to the
(dry) density had an average value of 1.27 g/cm3. The oxidation of the existing sulphide minerals by the in-
average porosity was 50% whilst the average particle teraction with the atmosphere, thus evidencing their
density was 3.43 g cm-3. Figure 4 represents the grain characteristic behaviour as acid producers.
size distribution of different superficial and deep sam- The chemical composition of the samples is shown
ples (Figueiredo, 2019). There is an evident heteroge- in Table 2. Other elements that did not have significant
neity, although the silt fraction is always prevalent in concentrations were also analysed and had grades
all the samples. below or near the detection threshold (Ga, Ge, Mo,
 The grain size becomes slightly finer with depth and Ag, In, Au and Pb).
the overall weighted median grain size is 26 µm For this The following minerals were found (Grangeia et
median grain size, the settling velocity is 5.37 cm/s. al. 2011): quartz, mica, feldspar, illite-vermiculite, ar-
 Table 1 shows an example of average values for a su- senopyrite, marcasite, pyrite, pyrrhotite and chal-
perficial and for a deep sample, as well as the respecti- copyrite. Some other minerals, such as scorodite
ve values for the uniformity and curvature parameters. (FeAsO4.2H2O) and natrojarosite, resulting from the

 471

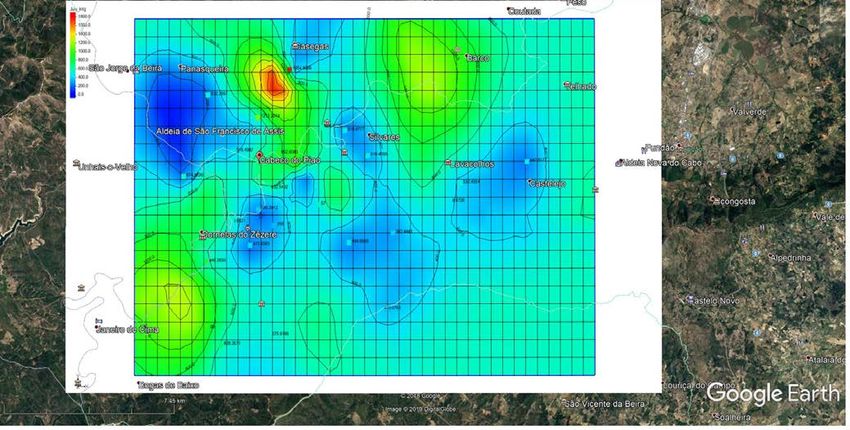
Fiúza, A., et al, 2021. Quantitative Risk Assessment of Environmental Hazards Generated by a Tailing Embankment..., 132 (4): 465-486

Table 2. Average concentrations of the main elements (80 samples).
Tabla 2. Concentraciones medias de los elementos principales (80 muestras).

oxidation of arsenopyrite, were also present in sma- followed the DIN38414-S4 standard. The main conclu-
ller quantities and enriched in As, Cu, Mn, Pb and Zn. sions were:
 The typical reaction of the oxidation of arsenopyrite a. all the samples showed an acidic pH ranging from
in the supergene environment is the following (Dove 2.0 to 3.8, revealing oxidation of sulphides with the
and Rimstidt (1985), release of hydronic cation;
 It is a chemical reaction that produces the acid that b. the superficial samples produce a greater amount
 of acid (lower pH between 2.0 and 2.3) than the dee-
 + 14 3+ + 10 2 → 14 2+ + 42− + 4 . 2 2 + 16 +
 per samples, with values of between 3.2 and 3.8;
 c. for the superficial samples the pH remains approxi-
infiltrates through the tailings embankment, outcro- mately constant whilst for the ‘deeper’ samples
pping on its base on the left bank of the Zêzere River there is a time delay in the production of acid, de-
where the low pH (2.6 to 3.8) of the runoff waters and caying on average from 3.8 to 3.2.
the abundance of iron precipitates is evident, as a re- Two methods were used for predicting the acid ge-
sult of the oxidation of the sulphides. neration: the modified acid-base accounting method
 (Coastech, 1989) and the net acid generation (NAG)
Simulation of Natural Leaching procedure (Coastech, 1989). All the tests, with all the
 chosen samples, evidenced an extremely high capaci-
Some of the samples collected were used to perform ty for acid generation.
natural leaching tests, performed in stirred beakers
with distilled water for a maximum period of 24 h. The Climate, hydrological cycle and model of water circu-
tests were interrupted to collect samples of the liquid lation and balance
phase after 1, 3, 12 and 24 hours. In these samples,
pH, dissolved oxygen, salinity, total dissolved solids, The meteorological data obtained during the last 30
conductivity and temperature were measured. The years from a nearby locality, were used to characte-
solid residues were analysed and the chemical com- rise the mean values of the daily maximum tempe-
position was compared with the initial one. The tests ratures, daily minimum, daily average and monthly

Figure 5. Catchment areas and main water streams.
Figura 5. Áreas de captación y principales corrientes de agua.

 472
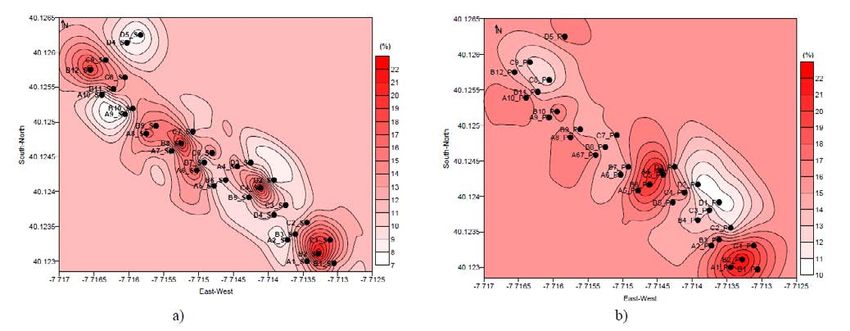
Fiúza, A., et al, 2021. Quantitative Risk Assessment of Environmental Hazards Generated by a Tailing Embankment..., 132 (4): 465-486

 minimums, as well as the wind velocity and precipi-
 tation (Meteoblue Data Source). The histogram of the
 average monthly precipitations identifies three dis-
 tinct rainfall periods: i) a dry period (includes June,
 July, August and September) coincident with the hi-
 ghest temperatures; (ii) a rainy season (October, No-
 vember, December and January); (iii) a transitional
 period (February, March, April and May). The annual
 mean values published for precipitation (1,300 mm),
 superficial runoff (400 mm, European Environmental
 Agency) and evapotranspiration (900 mm) (Lúcio do
 Rosário, 2004) were selected to implement a water
 balance. Figure 5 shows on the left the areas of the Table 3. Water balance for the storage embankment
 sludge storage, as well as the areas for inflow and Tabla 3. Balance de agua para el almacenamiento de relaves
 outflow runoff, where the values were determined. In
 the tailings embankment it is possible to distinguish From this information, it is possible to estimate an
 three water streams, represented by yellow lines (Fig. average flow of infiltrated water, which will be in con-
 5, right) that discharge to the deposit. tact with the tailings of 33,894 m3/year, corresponding
 Based on this information, it is possible to develop to an average approximate flow of 92.7 m3/d. As we
 a water balance for the study area and the conceptual are considering a steady-state situation, without va-
 model is presented in Figure 6. riation in the volume of water stored within the em-
 The storage area receives the direct precipitation bankment, the same flow will be drained to the river-
 and the runoff from the higher levels that drain to the bank after some residence time. This value was used
 site as input. It has two outputs: the water lost by eva- in the environmental dispersion models for quantif-
 potranspiration and by infiltration (Table 3). ying the risk.
 The total volume of sludge in the embankment is
 730,000 m3 with a porosity of 50%. If we still consider
 that the average depth of the unsaturated zone is 4 m,
 according to the drills (Gama, 2002) the total volume
 of stored water is 320,000 m3 with an average residen-
 ce time in the embankment of 10.7 years.

 Quantification of hazardous elements existing in the
 embankment

Figure 6. Hydrological balance of the conceptual model. The distribution of heavy metals within the embank-
Figura 6. Modelo conceptual del balance hidrológico. ment is not homogeneous. Under the project Remine,

 Figure 7. Space distribution of arsenic concentrations for superficial (a) and ‘deep’ samples (b).
 Figura 7. Distribución espacial de las concentraciones en arsénico para muestras superficiales (a) y “profundas”(b).

 473
Fiúza, A., et al, 2021. Quantitative Risk Assessment of Environmental Hazards Generated by a Tailing Embankment..., 132 (4): 465-486

Albuquerque et al., (2017) verified by “Cluster analy- carried out by Candeiasa (2014), which made several
sis” that As was associated with Sn, whilst Cu, Zn and collections of leachates, the mean values obtained
Cd were associated with each other. were as follows: pH (2.6 – 3.8), electrical conductivity
 The chemical grades were processed by geostatistics (679 – 733 mV), high Fe concentrations (12 – 172 mg l-1)
to estimate, predict and map their spatial distribution. with high concentrations in As (561 – 21,000 μg l-1), Cd
The geographic coordinates were used for geo-refe- (86 – 1179 μg l-1) and Cu (822 – 99,696 μg l-1). Whilst the
renciation of the grades, using the software Surfer® Cd concentrations agreed with our determinations, the
(Golden Software Inc., 2017). The final output was a set values for As and Cu are different. The disparity proba-
of spatial distribution maps, elaborated for each main bly results from the use of different sampling sites, and
element analysed with high abnormal concentrations. the high seasonal variability, typical of this type of sul-
 Experimental variograms were created through the phide waste storage should also be taken into account.
spatial data structure analysis, characterising the de- As a consequence, it was extremely difficult to se-
gree of spatial dependence between samples (Figuei- lect an average value for the arsenic concentration
redo, 2019). The best fit model of the experimental va- in the leachates, given its high spatial variability and
riogram was the spherical model (Figueiredo, 2019). seasonal variation. A perspective of parsimony was
Kriging was chosen to perform the netting interpola- adopted, so that the minimum average value measu-
tion of the georeferenced information, thus allowing red in the samples was assumed as the average value
a spatial inference of quantities in unobserved loca- (6,300 µg l-1) which is much lower than the maximum
tions and quantifying the uncertainty associated with observed in previous studies. Considering the exis-
the estimator. The space distribution of arsenic for su- tence of a volume of leachate within the storage of
perficial and for deep samples are shown in Figure 7 sludge to be 320,000 m3, the amount of arsenic lea-
(Gois, 2018). ched (dissolved) is 2,016 kg.
 In the assessment of the total quantities of the diffe-
rent heavy metals existing in the sludge embankment, Considerations on structural stability and the risk of
the primary data used for calculation was the estima- rupture of the tailings dam
ted volume of material existing in the dam (730,000
m3), the average concentrations of the ‘deep’ samples The data obtained from the surveys has allowed us to
and the average wet density (2.23 t/m3). The assessed construct a model for the groundwater drainage sys-
values are shown in table 4. tem (Fig. 8).

Table 4. Estimation of the quantities of the different heavy metals
and metalloids stored in the sludge embankment.
Tabla 4. Estimación de las cantidades de los diferentes metales y
metaloides pesados almacenados en la presa de relaves.

Oxidation of sulphides and formation of acid mine
drainage
 Figure 8. Conceptual model for the flow of the infiltrated water
The acid-producing tests evidenced a high capacity for based on the results of drilling (Ineti, 2006)
acid generation that was confirmed in the field. For this Figura 8. Modelo conceptual para el flujo del agua infiltrada basada
purpose, two campaigns were performed to collect lea- en resultados de sondeos (Ineti, 2006)
chate samples at the base of the slope, in March and
June 2018. The values obtained are in Table 5. In this model there is a resurgence of water on the
 surface of the embankment slope, at a distance from
 the crest of about 40 meters. This resurgence may
 be responsible for the erosive process visible in the
 slope, resulting from the flow of leachates in the tai-
 lings/bedrock interface. In 2010, Silva (2010) made a
Table 5. Concentration in heavy metals and metalloids of the geophysical survey of the crest and the slopes of the
leachates produced in the tailings embankment. dam, using ground-penetrating radar (GPR). Six pro-
Tabla 5. Concentración en metales pesados y metaloides en los files were produced on the crest of the dam and three
lixiviados producidos en los relaves. on the slope confirming this model and interpretation.
 Although several different dam failures may occur
 The concentrations in As show a high discrepancy (overtopping, piping, foundation, excessive water level,
between the two measurements. In previous studies seismic events) rupture due to the erosion of the con-

 474
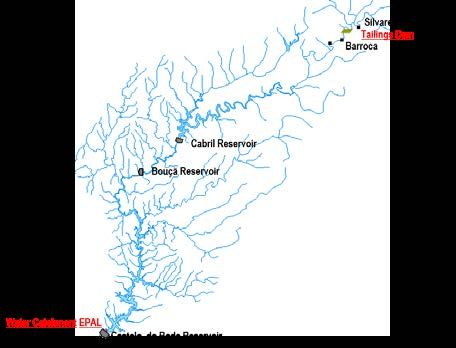
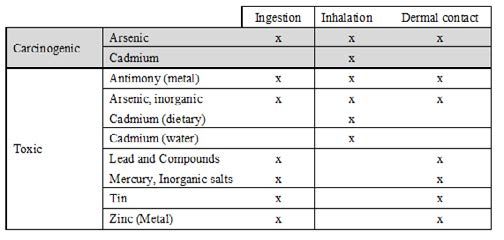
Fiúza, A., et al, 2021. Quantitative Risk Assessment of Environmental Hazards Generated by a Tailing Embankment..., 132 (4): 465-486

tainment wall of the embankment could be considered Figure 10 shows the drainage basin of the Zêzere ri-
the most probable. The water that arrives at the dam ver, with the locations of the nearest three water dam
(precipitation and superficial runoff) flows through the reservoirs as well as the tailings disposal (‘Escombre-
storage of sludge that is supported at the bottom by the ira do Rio’). The nearest water reservoir, Barragem do
bedrock. As the hydraulic conductivity of the unfractu- Cabril has a capacity of 720 hm3.
red bedrock is very low (from 10-9 to 10-12 m s-1 for this The most probable location for this rupture is the
type of rock formation), acting as an impervious layer, area affected by the predominant runoff water line
the infiltrated water flows through the exposed slope where the decrease of the height in the crest of the
progressively eroding the base of the containment wall. dam and the sharp erosion of the slope is already vi-
 The infiltrated waters first flow through a sub-verti- sible (Fig. 11).
cal descending movement that continues by a slightly
sub-horizontal inclined movement in the area of contact
with the pre-existing rock formations (bedrock), leading
to piping with water resurgence on the exposed slope, in
the area where the bedrock supports the wall. The base
of the containment wall is progressively eroded and can
lead to its collapse, as evidenced by the visible gullies
at the site. This erosive action is continuous, originating
the removal and continuous transport of the materials
that constitute the support wall (Fig. 9).
 Figure 11. Most probable area of rupture due to erosion of the
 embankment wall and erosion zones below the support wall.
 Figura 11. Zona más probable de colapse por erosión del muro de
 la presa y zonas de erosión debajo del muro de soporte.

 If such a failure occurs, with the partial release of the
 material stored in the zone shown in Figure 11, it will
 lead to the release, in a short space of time, of 200,000
 m3 of waste, equivalent to 490,600 tonnes, with a total
 arsenic content of 73,590 tonnes. This release would
 occur under simultaneous associated erosive action
Figure 9. Collapse of the embankment wall.
 at the dam crest and in the resurgence zone in the
Figura 9. Colapse del dique de la presa. slope. Simultaneously, about 91,400 m3 of leachates
 would be released with an average concentration of
 6,300 µg l-1 which corresponds to a release of 575.8 kg
 This type of failure is the most probable to occur and of dissolved arsenic.
will lead to a partial collapse of the dyke retaining wall,
which will fall into the valley, destroying the crest of the Legislation, toxicology and selection of hazardous
dam in the neighbouring upper area, thus allowing the elements
flow of the stored sludge. Naturally, this type of acci-
dent is most likely with the action of heavy rain. In Portugal, the last inventory of closed mining waste
 facilities, made publicly available in 2013, complying
 with the provisions of Directive 2006/21/EC and fo-
 llowing Decree-Law No. 10/2010 and 31/2013, consi-
 ders that the tailings of Cabeço do Pião do not exist in
 an abandoned mine. It also considers that the tailings
 are already safely contained and therefore do not ori-
 ginate leachates, acid drainage and dust that could
 affect the normal usage of the soil, with only some
 safety problems (presumably related to the stability
 of the side-hill impoundment). On the other hand, if
 the tailings are considered as waste, the European
 Commission Decision 2014/955/EU, referred as the
 Union List of Hazardous Waste and the Commission
 Regulation (EU) No 1357/2014, considers the sludge
 as carcinogenic with the Hazard Class HP7 (Regula-
 tion (UE) N.O 1357/2014). The following toxicological
 effects should then be considered: acute toxicity 3 (in-
Figure 10. Drainage basin of the Zêzere River (Ferreira R., 2012). halation) (H331), acute toxicity 3 (oral) (H301), aquatic
Figura 10. Cuenca de drenaje del río Zézere (Ferreira R., 2012). acute toxicity 1 (H400) and chronic aquatic toxicity 1

 475
Fiúza, A., et al, 2021. Quantitative Risk Assessment of Environmental Hazards Generated by a Tailing Embankment..., 132 (4): 465-486

(H410) (Regulation UE N.o 1357/2014). If the tailings several days and then declines, until a normal value
are considered as contaminated soil, then the legis- is reached (U.S. EPA, 2001). Drinking water represents
lation applicable in Portugal is the Environmental the greatest danger since the species present in the
Protection Act of the Ontario State (Canada), and the groundwater are predominantly inorganic forms, and
elements Sb, As, Cu and Zn are above the permitted are the most toxic. The actual legislation for maxi-
concentrations. mum concentration in drinking water is 10 µg l-1, fo-
 To select the toxic and the carcinogenic elements llowing the WHO recommendations.
the database IRIS (Integrated Risk Information Sys- Chronic exposure to arsenic in ingested water is re-
tem), made for EPA by the National Library of Medi- lated to an increased risk of cancer in the skin, lungs,
cine, in the United States (US EPA, 1997, 2013, 2014 bladder and kidneys, as well as skin alterations such
) was used. The conclusions are displayed in Table 6. as pigmentation and thickness alterations (hyperkera-
 tosis). It is estimated that at least 500 million people in
 the entire planet are consuming arsenic above the li-
 mits recommended by the World Health Organization
 (10 µg l-1).

 Characterization and quantification of the reference
 state

 Surface water

 The Zêzere River has for subsidiary, a water stream
 called “S. Francisco stream” or “Casinhas stream”,
 which receives eventual leachates produced by the
Table 6. Carcinogenic and toxic heavy metals and metalloids in the
tailings.
 main tailing disposal of the Panasqueira Mine, locat-
Tabla 6. Metales pesados y metaloides cancerígenos y toxicos en ed in Barroca Grande (Fig. 12). The concentrations of
los relaves. arsenic in water, as well as many other cations and
 anions, also including the typical parameters of water
 As usually happens in toxicological environmental quality, were surveyed by Candeiasa et al., (2014). The
impact studies out of all these elements, just one or author collected samples from runoff water, from the
two elements are responsible for more than 99% of S. Francisco stream and the Zêzere river.
the potential toxic load. For this reason, only arsenic
was considered in the environmental impact assess-
ment.

Toxicology of arsenic

Arsenic is present in all living organisms and the total
quantity in the human body varies between 3 and 4
mg increasing with age (U.S. EPA, 2014). Except for
hair, nails and teeth the analyses revealed that most
of the human body tissues contain less than 0.3 mg/
kg (Samanta et al., 2014). In the United States, the
median arsenic content of 1,000 human hair samples
was 0.51 mg/kg, and the medians were 0.62 and 0.37
mg/kg respectively for males and females (Fowler et.
al, 2015). The nails of a patient with acute polyneuro-
pathy due to arsenic poisoning contained 20 to 130
mg/kg, whilst the normal nail concentration was 0.43
– 1.08 mg/kg (WHO, 2001).
 Human exposure to arsenic is mainly due to food
and water intake (Bundschuh, 2007). From these the Figure 12. Panasqueira Area with water streams (Cláudio dos Reis).
 Figura 12. Área da Penasqueira con cursos de agua (Cláudio dos
diet is usually the main contributor to the daily dose Reis).
ingested. The arsenic concentration of the urine va-
ries from 0.1 to 1.0 mg l-1 (WHO, 2001). Large daily va- Analysis of water samples collected in the S. Fran-
riations are depending on the food consumed throu- cisco stream, in the Zêzere river before and after the
ghout the day, the highest concentrations being found tailings embankment drew the following conclusions:
with the consumption of shellfish (WHO, 2001). When - The runoff waters of the Cabeço do Pião em-
arsenic is ingested, the amount excreted increases for bankment have the most acidic pH (2.9 to 3.2)

 476
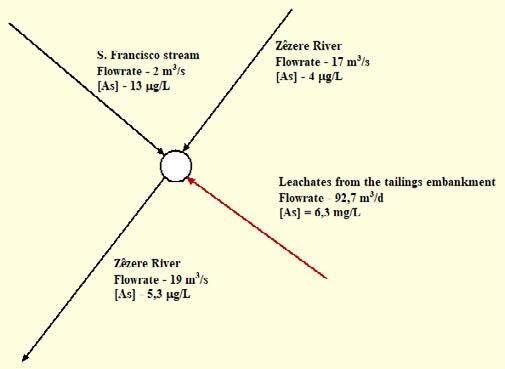
Fiúza, A., et al, 2021. Quantitative Risk Assessment of Environmental Hazards Generated by a Tailing Embankment..., 132 (4): 465-486

 and the highest values in concentrations in Al -
 The second scenario considers the occurrence
 (99 to 161 mg l-1), As (146 to 2140 µg l-1), Cd (226 of a failure in the tailings dam, with partial co-
 to 464 µg l-1), Cu (20.2 to 54.3 mg l-1), Mn (22.3 to llapse and release of a large amount of ‘sludge’
 92.6 mg l-1) and Zn (21.9 to 49.2 mg l-1). They also and leachates in a short time interval. Mathe-
 show high concentrations in suspended solids; matically, it can be represented by an instan-
 - The concentrations in arsenic in runoff waters taneous release (impulse) or by a rectangular
 originated at the embankment are very high pulse.
 (frequently over 2,000 µg l-1), whilst they are sli- For the first environmental scenario the following
 ghtly above the drinkability threshold in the S. hydrological data, collected from Ferreira et al., (2012)
 Francisco stream (13 µg l-1) and much lower in were considered:
 the river background (4 µg l-1). - Width of the riverbed in Cabeço do Pião varia-
 - The low concentrations of arsenic in the river ble between 30 and 56 m; At the base of the em-
 water can be explained by the fact that this ele- bankment the average value is 30 m.
 ment is sorbed by the iron oxides and hydroxi- - Flow rate (m/s) – 1,05.
 des, precipitating at the bottom of the river and - Average depth of the river at location – 1.2 m.
 integrating the sediments. - Estimated flow rate on an empty cross-section
 - During the rainy season, the pH increases (3.9 basis – 19 m3/s.
 to 5.7) and the secondary minerals dissolve re- For the second scenario the following assumptions
 leasing arsenic. The dissolution and precipita- were considered:
 tion of these secondary minerals are strongly - Release of 200,000 m3 of waste in a short time
 affected by the cycles of rainfall and drying (for interval under the action of a failure originated
 example, Fe may vary between
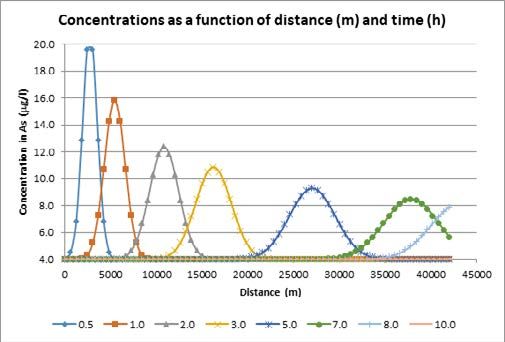
Fiúza, A., et al, 2021. Quantitative Risk Assessment of Environmental Hazards Generated by a Tailing Embankment..., 132 (4): 465-486 The following mechanisms of transport and fate were In the application of the model, it was considered considered for arsenic: transport by the river (with ad- that there was no transfer to the atmosphere and that vection, sorption into sediments and bio-concentra- there was no biodegradation, the with sorption into tion in fish), atmospheric transport by incorporation the suspended sediments consisting of a high percen- into dust, dust deposition and concentration in the tage of iron oxide-hydroxides, the only degradation soil and flora. mechanism. The sorbed fraction in the sediments was A mathematical model of transport by the river with 70%, with 30% the fraction of As dissolved in water advection and degradation was used: was also recognised. The values for the main parame- ters involved in the risk assessment model are shown ∂C ∂C in Table 7. = −u − λC ∂t ∂x or in steady-state conditions dC u + C = 0 dx where C represents the concentration in As that depends on location in the river (x – distance to the origin – point of entrance of the leachates), λ is a pseu- do-first-order kinetic constant. The kinetic constant incorporates sorption in suspended particles, the de- position of sedimentation of particle aggregates, the degradation processes (sum of hydrolysis, photolysis, biodegradation and others), and the eventual volatili- sation. Protolysis does not occur in this case. Initially, the As concentration in the Zêzere River is calculated at the inlet site of the leachates generated at the tailings embankment. Conceptually the river, with a flow rate of 17 m3/s and with an average concentra- tion in As of 4 µg l-1 is initially mixed with the water from the S. Francisco stream which has an average Table 7. Values for the parameters involved in the risk assessment. concentration in As of 13 µg l-1 and where the flow is Tabla 7. Valores de los parámetros implicados en la evaluación del assumed to be 2 m3/s. This watercourse then receives riesgo. the flow of leachates from the sludge embankment, The application of the model showed that the con- about 92.7 m3/d (i.e. 0.001 m3/s) with a concentration centrations of As in the water of the Zêzere river is of 6.3 mg l-1. Assuming immediate mixing effects, the poorly attenuated, ranging from 5.3 µg l-1 to 5.25 µg Zêzere River would have a flow rate at the inlet point l-1 thirty kilometres away. This concentration profile is of 19 m3/s with an average arsenic concentration of due to the fact that the only degradation mechanism 5.3 µg l-1 (Fig.13). is sedimentation. In contrast, the average concentra- tion found in fish is 162 µg/kg, because the bio-con- centration factor (BCF) for As is high (44 L/kg). The river also transports the particles released from the embankment. The distance travelled before sedi- mentation at the bottom of the river bed depends on the average flow velocity. For the average values as- sumed, adopting a depth for the river of 1.2 m and a velocity of 1.05 m/s, it is possible to estimate the distances to which the particles of different sizes are transported, using a settling model (Major, 1978). The particles with the median grain size (26 µm) travel 1.5 km before settling, whilst the finer particles, for exam- ple with a size of 5 µm, would travel 38 km. A particle of size 2 µm could travel, ideally without obstacles, 240 km. Granjeia et al., (2014) measured the concentrations of heavy metals in the sludge and in the sediments in the left bank of the Zêzere River in the Cabeço do Pião Figure 13. Average flowrates and As water concentrations. area. The relevant mean values obtained for arsenic Figura 13. Caudales medios y concentraciones de As en el agua. was 73,649 µg/kg. 478
También puede leer